Get a Free WorkTrek Demo
Let's show you how WorkTrek can help you optimize your maintenance operation.
Try for freeKey Takeaways:
- OEE (Overall Equipment Effectiveness) is the gold standard metric for measuring manufacturing productivity — combining Availability, Performance, and Quality into a single score.
- A world-class OEE score is 85%. The typical discrete manufacturer averages around 60%, which means a third of potential production capacity is being lost.
- Unplanned downtime alone accounts for 34.2% of all OEE efficiency losses across discrete manufacturing sectors.
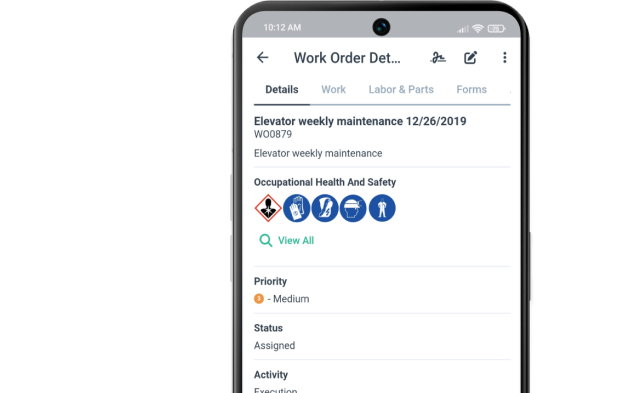
- A CMMS like WorkTrek gives maintenance teams the real-time data, scheduling tools, and reporting they need to track OEE and drive meaningful improvement.
Walk into almost any manufacturing plant and ask the floor manager how their equipment is performing. Chances are, you’ll get a vague answer: something like “pretty well” or “we had a rough week.”

That’s the problem. In manufacturing, “pretty well” doesn’t pay the bills. Precise, data-driven insight does.
That’s exactly what Overall Equipment Effectiveness (OEE) was designed to provide. It’s not just another key performance indicator.
OEE is the single most powerful metric for understanding how effectively equipment is running. It can disaggregate where productivity is being lost and guide continuous improvement efforts on the production line.
Whether you’re a maintenance manager trying to reduce unplanned downtime, a plant director benchmarking against world-class standards, or a production engineer looking to optimize asset performance, this guide covers everything you need to know about OEE.
What Is Overall Equipment Effectiveness (OEE)?
Overall Equipment Effectiveness (OEE) is a standardized metric that measures what percentage of planned production time is truly productive.
In plain terms: it tells you how well your manufacturing equipment is actually working versus how well it could be working.
A perfect OEE score of 100% means your equipment is running at maximum speed, producing only good parts, with zero downtime. In the real world, that’s a theoretical ceiling — but it’s a critical target to measure against.
OEE was developed as part of the Total Productive Maintenance (TPM) framework, pioneered in Japan in the 1960s and 70s. Today, it’s recognized industry-wide as the gold standard for measuring manufacturing productivity and has become a foundation for lean manufacturing and continuous improvement programs.
| Why It Matters: OEE is the single best metric for identifying losses, benchmarking progress, and improving the productivity of manufacturing equipment — i.e., eliminating waste. |
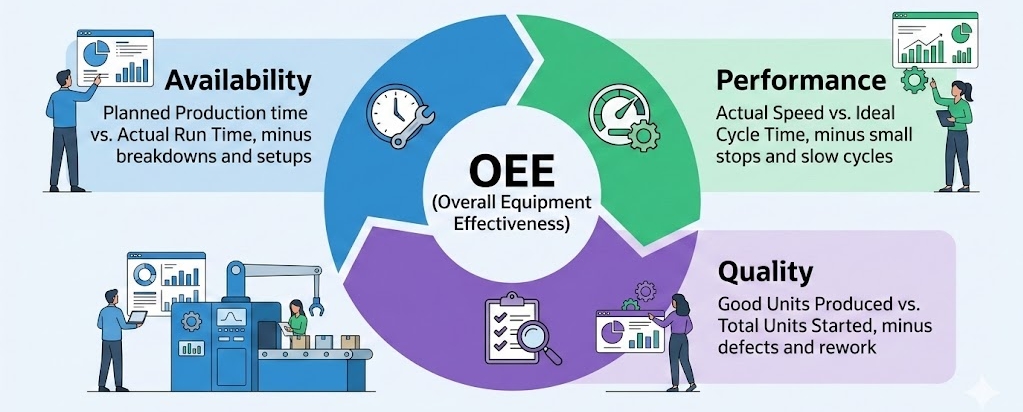
Crucially, OEE doesn’t just give you a single number. It breaks down into three components:
- Availability
- Performance
- Quality
Using these components can reveal exactly where your production processes are leaking time, output, and quality. That diagnostic power is what makes OEE far more actionable than a simple uptime or throughput figure.
The Three Pillars of OEE: Availability, Performance, and Quality
OEE is calculated by multiplying three factors together.
Each one captures a distinct category of production loss. Understanding all three is essential to improving your OEE score.
1. Availability — Are You Running When You Should Be?
Availability measures the percentage of scheduled (planned) production time that equipment actually operates. It accounts for all stop time, including planned downtime such as changeovers or preventive maintenance, and unplanned downtime (like equipment failures or material shortages).
Availability = Run Time ÷ Planned Production Time
Example: If a machine is scheduled to run for 8 hours (480 minutes) but experiences 60 minutes of downtime,
Run Time = 420 minutes. Availability = 420 ÷ 480 = 87.5%.
An availability score of 100% means the process never stopped during planned production time. Key availability losses include equipment failures, unplanned stops, and setup/changeover time.
2. Performance — Are You Running as Fast as You Should Be?
Performance (also called the performance score or speed factor) measures how fast equipment runs compared to its maximum possible speed.
It captures losses from slow cycles and small, brief stops that interrupt flow without triggering a full downtime event.
Performance = (Ideal Cycle Time × Total Count) ÷ Run Time
Example: A machine has an Ideal Cycle Time of 1 second per part. During 420 minutes of Run Time, it produces 23,000 total parts. Performance = (1 sec × 23,000) ÷ 25,200 sec = 91.3%.
Reduced equipment speed, idling, and minor stoppages are the main culprits behind low performance scores. These are often overlooked because they feel minor individually, but they compound quickly across a production line.
3. Quality — Are You Producing Good Units the First Time?
Quality measures the ratio of good units produced compared to total units produced.
It accounts for production defects, rejects, and any parts requiring rework. OEE quality is similar to First Pass Yield; it only counts parts that pass quality standards on the first run, without rework.
Quality = Good Count ÷ Total Count
Example: Of 23,000 total parts produced, 22,500 meet quality standards. Quality = 22,500 ÷ 23,000 = 97.8%.
The OEE Formula and Calculation Example
Once you have your three factor scores, OEE is calculated by multiplying them together:
OEE = Availability × Performance × Quality
Using the example figures above:
OEE = 87.5% × 91.3% × 97.8% = 78.1%
That means only 78.1% of your planned production time was truly productive, and the rest was consumed by availability losses, performance losses, and quality losses.
And this OEE calculation example is actually better than many manufacturers achieve in practice.
| OEE Formula (Simplified): The simplest version of the OEE formula is: OEE = (Good Count × Ideal Cycle Time) ÷ Planned Production Time. This confirms that OEE is ultimately a measure of truly productive manufacturing time versus all planned production time. |
Understanding Your OEE Score: From Baseline to World-Class
Not all OEE scores mean the same thing. Here’s how to interpret yours:
| OEE Score | Status | Interpretation |
| 100% | Perfect | Perfect (theoretical) |
| 85%+ | World-Class | World-class |
| 60%–85% | Average | Average — room to grow |
| < 60% | Below Average | Below average — needs attention |
A world-class OEE of 85% is the target benchmark for discrete manufacturing companies. It’s calculated based on 90% Availability × 95% Performance × 99.9% Quality. Reaching this level requires relentless focus on eliminating waste across all three OEE factors.
Most manufacturers sit between 60% and 75% — meaning roughly 25–40% of production capacity is being lost to inefficiencies that can be identified and addressed. A baseline OEE measurement is your starting point for any meaningful improvement initiative.
| 34.2%of all OEE efficiency losses in discrete manufacturing come from unplanned downtime alone (Godlan, 2025) |
The Six Big Losses: Where OEE Goes to Die
The Six Big Losses are the root causes of OEE degradation. They map directly to the three OEE factors and give maintenance teams a practical framework for targeting improvement efforts:
Availability Losses
- Equipment Failures/Breakdowns: Unplanned downtime caused by unexpected equipment failures. This single factor accounts for the majority of availability losses in most plants.
- Setup and Changeover Time: Planned stops for product changes, tooling swaps, or reconfiguration. Setup and changeover time accounts for 28.7% of total OEE losses in make-to-order environments.
Performance Losses
- Idling and Minor Stops: Short interruptions that don’t trigger a formal downtime event but still reduce output. Often the hardest loss category to track without automated data collection.
- Reduced Speed (Slow Cycles): Equipment running below its maximum possible speed due to operator behavior, material issues, or mechanical wear — a silent productivity killer.
Quality Losses
- Production Defects and Scrap: Parts that fail to meet quality standards and cannot be reworked. Every defective unit represents wasted machine time, labor, and material.
- Startup and Yield Losses: Defects produced during startup, warmup, or after a changeover before the process stabilizes. These are quality losses that occur at the beginning of a production run.
| Why This Matters: Knowing which of the Six Big Losses is driving your low OEE score changes everything about how you respond. A plant suffering from equipment breakdowns needs a different solution than one struggling with reduced speed or startup defects. |
Why Measuring Manufacturing Productivity with OEE Actually Matters
It’s easy to dismiss OEE as another management metric. The truth is, the data tells a different story.
According to a 2024 Siemens survey, automotive plants alone incur approximately $695 million in annual losses due to unplanned downtime.
Across industries, manufacturers routinely lose 20–40% of their productive capacity to hidden inefficiencies that OEE is specifically designed to surface.

OEE serves two essential functions simultaneously:
- As a benchmark: Compare your equipment’s performance against industry standards, against similar assets in your own facility, or against different shifts running the same asset.
- As a baseline: Track progress over time as you implement improvement initiatives, allowing you to see definitively whether changes are working.
For manufacturing operations looking to improve competitiveness without major capital investment, OEE improvement is often the highest-ROI path available.
Amazingly, improving OEE from 60% to 75% on the same equipment, in the same facility, with the same workforce effectively adds 25% more productive capacity.
How to Improve Your OEE Score
Improving OEE isn’t about a single action — it’s about building a systematic approach to identifying and eliminating waste. Here’s where to start:
1. Establish a Baseline OEE Measurement
You can’t improve what you don’t measure. Start by calculating your current OEE using the formula above. This baseline OEE becomes your reference point for evaluating improvement efforts. Make sure your data collection process captures all three factors consistently.
2. Focus on Your Biggest Loss Category First
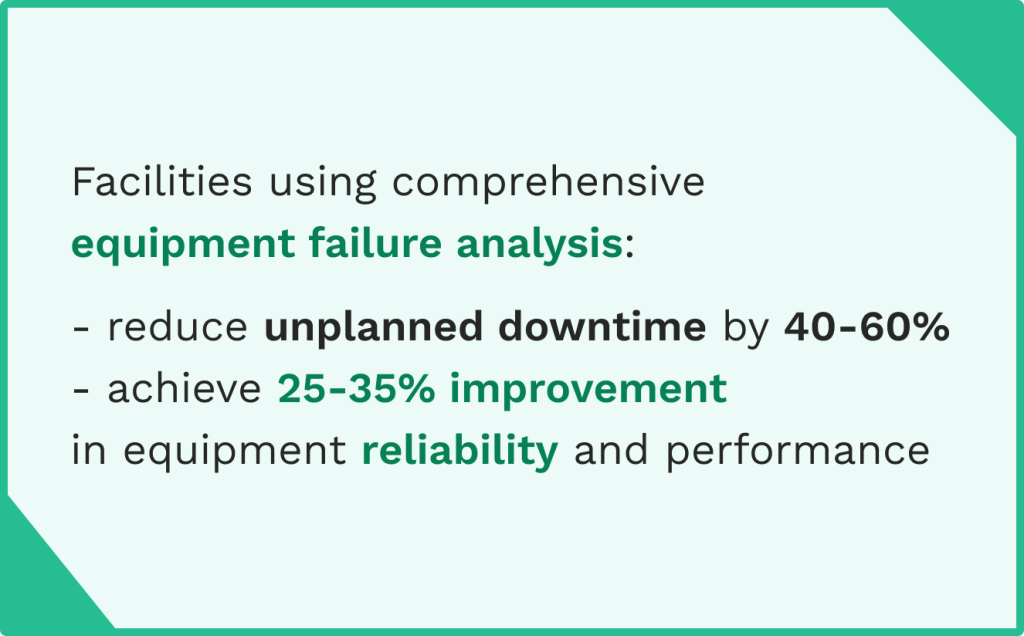
OEE data tells you where to focus. If availability losses from equipment failures are your primary constraint, as they are for most manufacturers, then prioritizing preventive maintenance will yield the most impact.
If performance losses dominate, look at slow cycles and minor stops. Targeted improvement beats scattered effort every time.
3. Implement Preventive and Predictive Maintenance
Equipment failures are the largest single driver of OEE losses. A robust preventive maintenance program reduces unplanned downtime by addressing potential failures before they occur. Going further, predictive maintenance (PdM) uses condition monitoring data to predict failures before they cause downtime, enabling maintenance to happen at the optimal time.
4. Reduce Setup and Changeover Time
Setup and changeover time accounts for 28.7% of OEE losses in complex manufacturing environments. SMED (Single-Minute Exchange of Die) techniques and standardized changeover procedures can dramatically reduce planned downtime and improve availability scores.
5. Build a Culture of Continuous Monitoring
OEE improvement is not a one-time project. It’s an ongoing process. Track OEE metrics by shift, by asset, and by production line to spot trends early. Review OEE data regularly in team meetings and use it to drive improvement initiatives. Ongoing improvement efforts require ongoing visibility.
6. Engage Plant Floor Employees
OEE is powerful at the management level, but its real value is unlocked when plant floor employees are actively engaged. Real-time production targets, downtime tracking, and shift-level OEE data give frontline teams the context they need to make better decisions in the moment.

How a CMMS Transforms OEE Tracking and Improvement
Here’s an uncomfortable truth about OEE: it’s only as useful as the data behind it.
Manual data collection is slow, error-prone, and often incomplete, and without accurate, timely OEE data, you can’t make informed decisions.
That’s where a Computerized Maintenance Management System (CMMS) becomes essential.
A CMMS doesn’t just help you do maintenance — it creates the data infrastructure that makes meaningful OEE improvement possible.
Here’s how a CMMS supports each dimension of OEE:
Improving Availability: Fewer Unplanned Stops
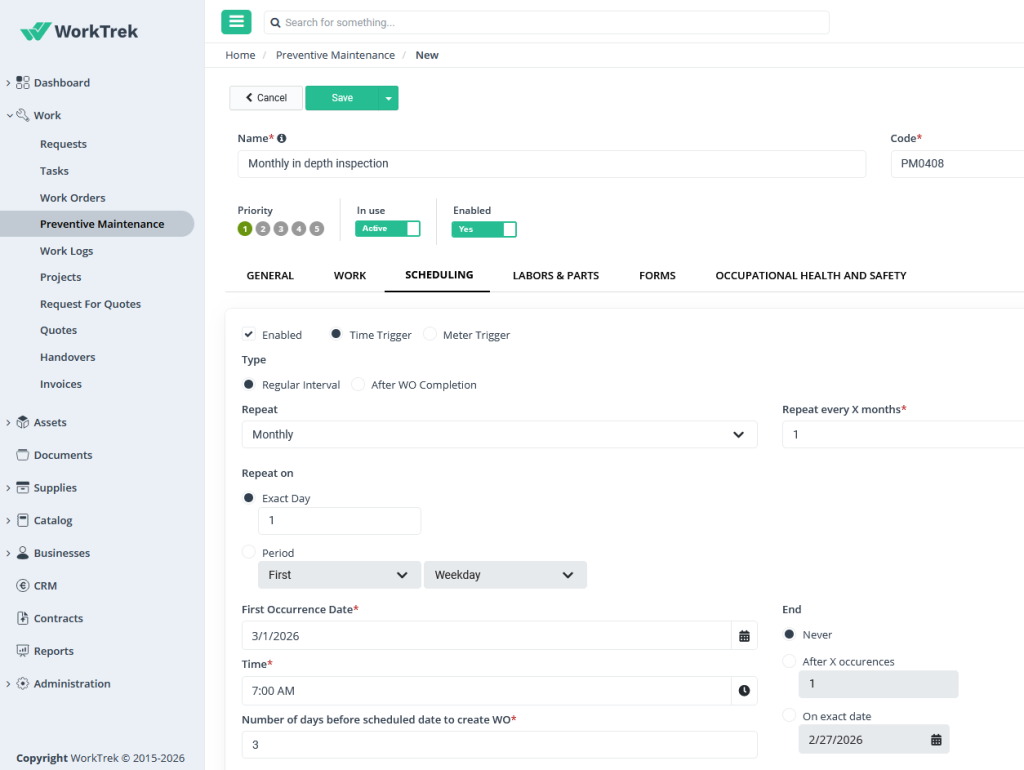
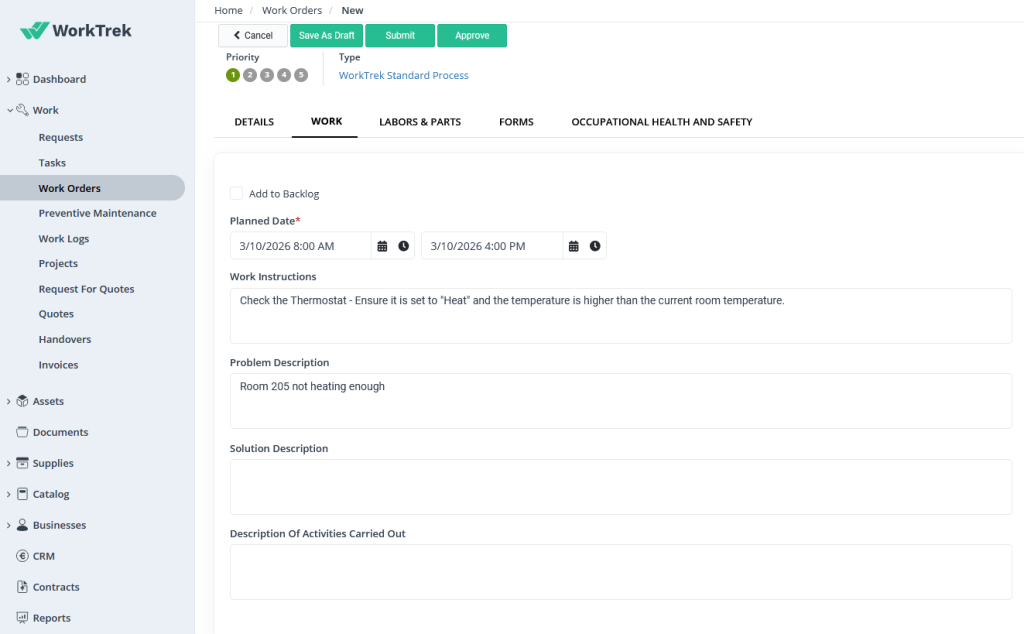
A CMMS automates preventive maintenance scheduling, ensuring that inspections, lubrications, and component replacements happen on time before equipment failures occur.
Maintenance teams get automated work orders, step-by-step task instructions, and complete visibility into what’s due and what’s overdue. Fewer missed maintenance tasks means fewer equipment breakdowns and dramatically better availability scores.
Improving Performance: Real-Time Visibility into Slow Cycles
Slow cycles and minor stops are hard to catch without real-time monitoring. A CMMS tracks work orders and equipment history, enabling identification of recurring issues that drag down performance. These are issues that might never be flagged under a reactive maintenance approach.
Improving Quality: Root Cause Analysis and Traceability
Production defects are often linked to maintenance failures. When equipment isn’t properly calibrated, lubricated, or serviced, quality suffers. A CMMS creates a complete maintenance history for every asset, giving quality and engineering teams the traceability they need to connect defect spikes to specific maintenance events.
| CMMS Impact: According to a 2024 UpKeep report, maintenance teams using CMMS platforms report dramatically better visibility into completed work, reduced unplanned downtime, and improved team collaboration — all of which directly improve OEE scores. |
Common OEE Mistakes to Avoid
Even companies that are tracking OEE often do it wrong. Here are the most common pitfalls:
- Using OEE without the three-factor breakdown: A single OEE number tells you how bad the problem is. Availability, Performance, and Quality tell you what to do about it. Don’t settle for the simplified calculation alone.
- Measuring OEE in isolation: OEE data is most powerful when tracked over time and across assets. One data point is noise; a trend is a signal.
- Excluding planned downtime from calculations: Some manufacturers exclude planned stops from OEE. While TEEP (Total Effective Equipment Performance) includes all time, standard OEE uses Planned Production Time as the denominator, which includes planned stops like changeovers and scheduled maintenance.
- Chasing a high OEE score at the wrong asset: Focus OEE improvement efforts on bottleneck equipment — the assets that most constrain your production output. Improving OEE on a non-bottleneck asset may not improve overall throughput at all.
- Neglecting employee buy-in: Successful OEE implementation requires everyone from technicians to plant managers to understand and trust the data. OEE should be a shared language, not just a management dashboard.
Conclusion
Overall Equipment Effectiveness forces manufacturing organizations to confront exactly how much of their potential capacity is being lost, and exactly why.
Whether your OEE score is 45% or 80%, there’s a clear path to improvement: measure the three factors, identify your biggest losses, implement targeted maintenance and operational changes, and track progress relentlessly.
The manufacturers who take OEE seriously, and back it up with the right tools, consistently outperform those who rely on intuition and anecdote. In a competitive manufacturing landscape, that advantage is real, and it’s compounding.