Blog
Operations & Maintenance
7 Tips for Extending Equipment Life
Key Takeaways: Heavy equipment is one of the biggest capital investments a business can make. Whether you’re running a manufacturing plant, a construction fleet, or a facilities operation, the machines that keep your operation moving aren’t cheap, and neither are the repairs when they break down. The problem? Most organizations are reactive rather than proactive. […]
Key Takeaways:
Systematic preventive maintenance extends equipment life by 20–30% while reducing unexpected breakdowns and operational costs.
A company will lose at least 5% of its productivity due to machinery malfunctions and repairs — and some firms lose as much as 20%, according to the International Society of Automation (ISA).
66% of companies now use a CMMS to optimize their equipment care and improve equipment uptime.
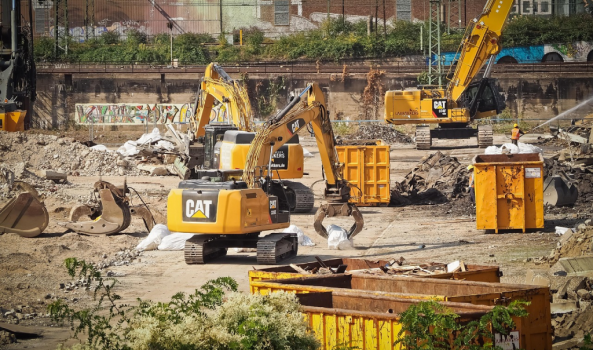
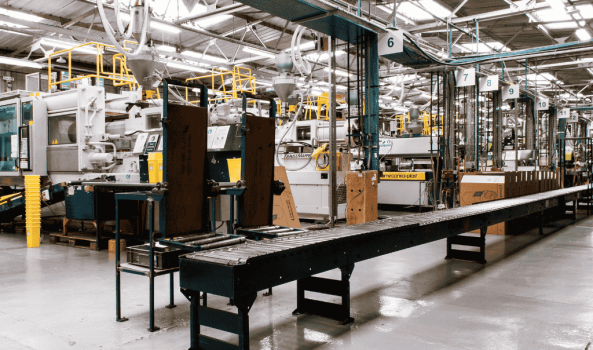
Heavy equipment is one of the biggest capital investments a business can make.
Whether you're running a manufacturing plant, a construction fleet, or a facilities operation, the machines that keep your operation moving aren't cheap, and neither are the repairs when they break down.
Illustration: WorkTrek / Data: Oxmaint
The problem?
Most organizations are reactive rather than proactive. They wait for equipment failure before taking action, leading to unplanned downtime, costly repairs, and lost revenue that could have been avoided entirely.
The good news is that extending equipment life doesn't require a massive overhaul of your entire operation.
It comes down to a handful of proven, practical habits that any maintenance team can implement.
This article covers seven tips for extending equipment life and getting the most out of every machine on your job site.
Tip 1: Build a Consistent Preventive Maintenance Schedule
If there's one thing that separates organizations with high equipment longevity from those constantly dealing with premature breakdowns, it's a disciplined preventive maintenance program.
Preventive maintenance — or PM — is a proactive approach to maintaining machinery before problems develop. Rather than waiting for something to break, you schedule maintenance at regular intervals based on machine hours, calendar time, or usage thresholds.
Source: WorkTrek
This keeps critical components in good working order and gives your maintenance team visibility into the overall health of your assets.
According to research cited by Brady Industries, systematic preventive maintenance extends equipment life by 20–30% while reducing unexpected breakdowns and operational costs.
That's not a minor improvement; that's the difference between replacing a machine in seven years versus ten.
A solid maintenance plan should go beyond simple filter changes and oil top-offs. It should include:
Scheduled service intervals aligned with manufacturer recommendations
Routine inspections tied to machine hours and usage patterns
Documented procedures that any member of your maintenance team can follow
Escalation paths for when minor issues are detected during routine service
One common mistake is letting production schedules push PM aside to speed up production.
Skipping or delaying scheduled maintenance to hit a production target is a bad idea.
The cost of a poorly maintained machine that fails at full capacity is far greater than the cost of a planned maintenance window. If your maintenance schedule keeps getting bumped, consider moving service to off-hours to protect both your production targets and your equipment.
Tip 2: Prioritize Proper Lubrication and Fluid Management
Lubrication is one of the most important and, according to studies, the most frequently mismanaged aspect of equipment maintenance.
Nothing destroys equipment faster than improper lubrication, where metal-on-metal contact generates heat that accelerates component wear.
This can cause warping, and eventually leads to failure. With it, moving parts operate smoothly, friction is reduced, and equipment runs significantly longer.
Every machine has specific lubrication requirements. Using the wrong lubricant or applying too much (or too little) can be just as damaging as skipping lubrication altogether.
Source: WorkTrek
Over-lubricating, for example, can damage seals and attract debris, accelerating wear.
Beyond lubrication, verify fluid levels across the board:
Hydraulic fluid
Coolant
Engine oil
Transmission fluid
Fluid analysis is particularly valuable for heavy equipment.
Regular sampling and lab analysis of your oil and hydraulic fluids can detect contamination, wear metals, and other warning signs long before they cause visible problems.
Think of it as a blood test for your machines. It can give you actionable data rather than guesswork.
Key fluid management practices to implement:
Check fluid levels at the start of each shift
Follow manufacturer-specified lubricant types and change intervals
Inspect for signs of excess oil, grease buildup, and leaks during every service
Use fluid analysis to get ahead of internal component wear
Proper lubrication is not glamorous, but it is one of the highest-ROI habits in any maintenance plan.
Tip 3: Conduct Routine Inspections and Catch Issues Early
The earlier you catch a problem, the cheaper it is to fix.
A thorough inspection program catches the minor issues that, left unchecked, become the catastrophic failures.
A dripping seal, a frayed wire, a loose belt, are not expensive to address at discovery. But ignore them for a few more weeks of machine hours, and that minor issue can cascade into a full system failure and thousands of dollars in unplanned repairs.
The Canadian Centre for Occupational Health and Safety highlights regular inspections as one of the key ways to mitigate workplace hazards.
This is a reminder that inspections aren't only about machinery longevity, but also about the safety of the people who operate it.
A good inspection routine covers:
Rust, cracks, dents, or warping on metal fixtures and structural components
Tire tread wear, punctures, cuts, and inflation levels
Hydraulic fluid levels and hose fittings
Fraying wiring or loose connections in electrical systems
Non-functional controls and safety mechanisms
Belt and chain tension
Filter condition and cleanliness
Source: WorkTrek
Daily pre-shift and post-shift walkarounds are very useful.
Monthly in-depth inspections covering every system. This includes mechanical, hydraulic, electrical systems, and structural.
Building these into your maintenance schedule with standardized checklists ensures consistency across your maintenance team and prevents critical steps from being missed.
Document everything.
Source: WorkTrek
Tracking what was observed and when provides historical data that helps identify recurring issues, spot trends in component wear, and proactively schedule replacements rather than reactively.
Tip 4: Train Your Operators
Your equipment is only as well-treated as the people operating it.
Poor operator habits such as excessive idling, overloading, improper technique, can accelerate wear and tear at a rate that no maintenance plan can fully compensate for.
Operator training should be a formal, recurring part of your operations, not a one-time onboarding event. It should cover:
Proper startup and shutdown procedures
Load limits and appropriate machine-to-task matching
How to recognize and report unusual sounds, smells, or performance changes
Pre- and post-shift inspection routines
Fuel and idle management to save fuel and reduce unnecessary engine wear
Matching the right machine to the right job is equally important.
Using a machine that's too large for a task wastes fuel and puts unnecessary stress on components. This is like oversizing an HVAC unit. It can be overkill, short cycle, and use more energy than necessary.
Source: WorkTrek
Using one that's too small exceeds its design limits and accelerates premature wear. Training operators to make these judgments correctly is one of the most underrated tips to extend equipment life.
Consider implementing formal refresher training on a quarterly or semiannual basis, especially when new equipment is introduced or usage data reveals inefficient operating patterns. The investment in operator training pays for itself many times over in reduced repairs and longer equipment service life.
Tip 5: Keep Equipment Clean
It may seem basic, but cleanliness is one of the most consistently overlooked aspects of equipment maintenance.
This is especially important in demanding environments like construction sites, manufacturing floors, and heavy industrial settings.
Dirt, dust, and debris are not just cosmetic issues.
They clog air filters, jam hydraulic fittings, hide developing cracks and leaks, contaminate lubricants, and accelerate corrosion. A clean machine is one where problems are visible and addressable before they become serious.
Cleaning heavy equipment thoroughly after use should be part of every operator's end-of-shift routine. This means:
Removing loose debris from the surface and undercarriage using brushes and cloths
Washing exterior grime with pH-neutral cleaners or mild soap
Using pressure washers for caked-on dirt (carefully, avoiding sensitive electronics)
Applying industrial degreasers to engine components and fittings
Cleaning battery terminals to remove corrosion buildup
Keeping a clean machine also makes inspections faster and more accurate.
Source: WorkTrek
When your equipment is covered in mud and grease, it's easy to miss a leaking hose or a stress crack. When it's clean, those early warning signs are visible and easy to act on.
Environmental conditions deserve special attention here as well.
Operating in dusty, sandy, or highly humid environments accelerates wear in ways that standard maintenance intervals don't account for. If your equipment runs in these conditions, increase your cleaning frequency and adjust filter inspection schedules accordingly.
Tip 6: Use High-Quality Fuel, Fluids, and OEM Parts
The quality of what goes into your equipment directly affects how long it lasts. This applies to fuel, lubricants, coolants, filters, and replacement parts alike.
High-quality fuel is especially important for diesel-powered heavy equipment.
Contaminated or degraded diesel can damage fuel injectors, reduce combustion efficiency, and cause the engine to run inefficiently.
In extreme environments, like particularly cold climates, fuel quality is even more critical, as low-grade diesel can gel at low temperatures and cause fuel system failures.
Premium lubricants formulated to meet industry standards provide better protection for engine components and reduce friction more effectively.
Good quality lubricants can potentially extend service intervals compared to generic alternatives.
The same logic applies to filters: OEM filters are designed to the exact specifications of your equipment and often carry significantly longer service lives than aftermarket options. According to Volvo Construction Equipment, OEM oil and air filters can last up to 1,000 hours, providing meaningful protection for your engine's critical components.
When replacement parts are needed, resist the temptation to cut corners with cheaper alternatives.
As noted by equipment maintenance experts, a seemingly affordable substitute part can result in a minor issue escalating into a major system failure.
Don't let a $20 decision that turns into a $2,000 repair or worse. Warranty claims may also be invalidated when non-OEM parts are used.
Tip 7: Account for Environmental Factors and Operating Conditions
Not all equipment operates in the same environment, and maintenance programs that ignore this fact leave performance and extended lifespan on the table.
Extreme heat causes fluids to degrade more quickly and puts additional strain on cooling systems. High temperatures can cause seals to fail prematurely and accelerate oxidation in lubricants.
Cold environments can cause hydraulic fluid to thicken, increasing startup wear.
Dusty job sites clog air filters faster than clean environments. High humidity accelerates corrosion on exposed metal components.
Illustration: WorkTrek / Data: Coastings World
The key insight here is that manufacturer-recommended maintenance intervals are typically based on average operating conditions.
If your machinery operates in conditions that deviate significantly from those baselines, you need to adjust your maintenance schedule accordingly. For example more frequent filter changes, more regular fluid analysis, and additional lubrication checks.
Proactive adjustments to environmental factors can also reduce the rate of damage accumulation. Spraying down work areas to reduce airborne dust, using weather-appropriate fluids and additives, and storing equipment properly when not in use all contribute meaningfully to heavy equipment longevity.
Why WorkTrek Is the Right CMMS for Equipment-Heavy Operations
WorkTrek is designed specifically for organizations that need to manage asset management, preventive maintenance, and field service operations in one unified platform. It's built around the realities of maintenance teams — practical, easy to use, and powerful enough to handle complex multi-site operations.
Source: WorkTrek
With WorkTrek, you can:
Automate preventive maintenance scheduling based on time, meter readings, or usage triggers, so nothing gets missed
Build and assign digital inspection checklists that standardize your team's inspection process across every asset
Track every work order from creation to completion, with full history attached to each piece of equipment
Monitor parts and inventoryto ensure scheduled maintenance is never delayed by missing supplies
Generate reports that give leadership visibility into maintenance costs, equipment downtime, and team performance
Unlike some CMMS platforms that require months of implementation and extensive IT support, WorkTrek is built to get your team up and running quickly, usually within a couple of weeks. In addition, it includes an intuitive interface that technicians actually want to use.
Organizations using WorkTrek report fewer unplanned downtime incidents, better collaboration between maintenance teams and operators, and significantly improved visibility into the health of their asset portfolios.
Source: WorkTrek
When your maintenance program runs on WorkTrek, extending equipment life isn't a goal you're working toward — it's a natural result of the system working as designed.
Conclusion
Equipment failure is usually the result of deferred maintenance, inadequate inspections, undertrained operators, or low-quality inputs. The good news, as described in this article, is that all of these are preventable.
Implementing the seven tips covered in this article that include:
Building a consistent preventive maintenance program
Managing fluids and lubrication properly
Conducting routine inspections
Investing in operator training
Keeping equipment clean
Using quality materials
Accounting for environmental conditions
All of this gives your team a proven framework for getting maximum life and performance out of every machine you operate.
And with a CMMS like WorkTrek supporting your maintenance team, you have the tools to execute that framework consistently, at scale, without things falling through the cracks.

Operations & Maintenance
Best Practices for Conducting Equipment Failure Analysis
Key Takeaways:
Effective failure analysis reduces unplanned downtime by 40-60% through systematic investigation and prevention techniques.
The global failure analysis market is projected to reach $7.65 billion by 2030, growing at 7.56% annually.
Proper documentation and data collection during failure analysis provide crucial evidence to prevent recurring failures and improve equipment reliability.
Equipment failures don't just happen. They often leave clues that can be useful for analysis.
When critical equipment fails, the immediate response is often to get it running again as quickly as possible. However, rushing to restore operations without understanding why the failure occurred practically guarantees you'll face the same problem again.
Source: WorkTrek
That's where equipment failure analysis comes in.
This investigation process identifies the root causes of equipment failures, helping you implement corrective and preventive actions that actually stick.
According to research from Mordor Intelligence, the failure analysis market is expected to reach $7.65 billion by 2030, growing at a compound annual growth rate of 7.56%.
In this guide, we'll walk you through the best practices for conducting equipment failure analysis.
The suggestions here will deliver real results, from proper data collection to the development of effective prevention techniques that keep your critical equipment running reliably.
Understand When Equipment Failure Analysis Is Needed
You don't need to perform a full-scale failure analysis on every equipment failure. The key is to identify when an investigation will deliver the greatest return on your time and resources.
Generally, equipment failure analysis makes sense when failures occur on critical equipment that directly impacts production, safety, or compliance.
You should also investigate when the failure was unexpected and:
Can't be explained by normal wear,
Unplanned downtime exceeds your established thresholds
Recurring failures that suggest deeper mechanical failures or material defects.
Source: WorkTrek
According to Siemens' 2024 True Cost of Downtime report, the 500 biggest companies globally lose approximately $1.4 trillion annually due to unplanned downtime.
This is equivalent to 11% of their total revenues.
In the automotive sector, an idle production line at a major plant costs up to $2.3 million per hour.
These staggering numbers make it clear why identifying and eliminating failure patterns through proper failure analysis is so critical.
On the flip side, you probably don't need formal failure analysis for routine wear items that failed as expected.
For example, minor failures with minimal operational impact, or issues where the cause is immediately obvious and easily corrected.
Assemble the Right Investigation Team
Failure analysis requires a team with diverse perspectives and expertise.
Complex failures often involve multiple contributing factors spanning mechanical, operational, and organizational issues. A cross-functional investigation team helps ensure you identify all relevant failure mechanisms.
Your team should typically include the maintenance technician who knows the equipment best, an experienced maintenance manager or reliability engineer to lead the investigation, operators who were running the equipment when it failed, and specialists based on the failure type (electrical engineers for electrical failures, materials experts for metallurgical issues, etc.).
Illustration: WorkTrek / Data: Oxmaint
According to maintenance experts, serious investigations require diverse skills to ensure rigorous, wide-ranging analysis. Representation from production, quality, management, and purchasing provides different perspectives that help avoid jumping to conclusions.
The size and composition of your team should scale with the severity and complexity of the failure.
A simple bearing failure might need just two or three people, while investigating a major failure with safety risks or significant production impact might require a larger team with specialized expertise.
Secure and Document the Failure Site
Before anyone touches the failed equipment, secure the failure site and document everything. This important step preserves crucial evidence that could be lost once repair work begins.
Start by implementing lockout/tagout procedures immediately to ensure everyone's safety. Then photograph and video the equipment from multiple angles before anyone disturbs anything. Capture the position of components, surrounding conditions, fluid levels, instrument readings, and any visible damage.
Source: WorkTrek
The maintenance team should document operating conditions at the time of failure, including temperature, pressure, flow rates, vibration levels, and any abnormal sounds or behaviors that operators noticed.
According to root cause analysis experts, thorough documentation during this phase often uncovers evidence that becomes critical later in the investigation.
Many stalled investigations restart only after someone documents details that were previously overlooked.
Collect any relevant sensor data, maintenance logs, and operational data from your CMMS or monitoring systems.
This historical context helps you understand whether the failure was sudden or the result of gradual degradation.
Collect and Preserve Crucial Evidence
Data collection is the foundation for effective failure analysis.
Start by retraining physical evidence, since it will be important for your analysis. When possible, remove and preserve the failed component before attempting repairs.
If you must restore the equipment quickly, at a minimum, take detailed photos and measurements before disassembly. Collect fluid samples (oil, coolant, hydraulic fluid) for analysis, especially if contamination is a concern. Save wear particles, broken pieces, or any material that separated from components.
Your data collection should also include maintenance history from your CMMS showing:
Last preventive maintenance date
Work history that was performed
Any data on modifications or repairs related to the equipment
Illustration: WorkTrek / Quote: CONEXPO-CON/AGG
Operational data analysis reveals important context about how the equipment was being used when it failed.
Another tip is to review production schedules, throughput levels, recent changes in operating conditions, and environmental factors such as temperature or humidity.
Research from Deloitte shows that effective data-driven decision making through condition monitoring and sensor data can reduce maintenance planning time by up to 50% while improving reliability.
The more thorough your data collection, the more likely you are to identify the true root cause rather than just treating symptoms.
Use Appropriate Failure Analysis Techniques
Selecting the right failure analysis techniques ensures you conduct a systematic investigation rather than jumping to conclusions. Different methods work better for different types of failures.
Root cause analysis (RCA) should be your go-to technique for most equipment failures. RCA uses structured questioning (like the "5 Whys" method) to drill down from symptoms to underlying causes. It helps distinguish between immediate causes, contributing factors, and true root causes that need to be addressed.
Source: WorkTrek
Failure mode and effects analysis (FMEA) is particularly valuable for preventing failures before they happen. This proactive technique identifies potential failure modes, assesses their effects on operations, and calculates a risk priority number based on severity, occurrence, and detection ratings. FMEA helps you focus prevention efforts where they'll have the greatest impact.
Fault tree analysis works well for complex failures with multiple contributing factors. This top-down, deductive approach maps out all possible causes that could lead to a specific failure event, showing how different factors combine to create problems.
For analyzing trends across multiple failures, data analysis techniques like Pareto analysis help identify which failure mechanisms are most common. Tracking patterns in maintenance logs and sensor data can reveal developing problems before they cause major failures.
Oil analysis and vibration analysis are essential condition-monitoring techniques that provide early warning of developing mechanical failures, such as bearing failures, misalignment, or lubrication issues.
According to industry research, vibration analysis can detect developing problems with 85-95% accuracy, typically providing 3-8 weeks of warning before failure.
The best maintenance teams don't rely on just one technique. They select methods appropriate to the specific failure and combine approaches for comprehensive analysis.
Identify Root Causes, Not Just Symptoms
One of the most common mistakes in equipment failure analysis is stopping at symptoms instead of drilling down to root causes. Fixing symptoms might get the equipment running again, but it doesn't prevent recurrence.
For example, if a bearing fails, the immediate cause potentially might be insufficient lubrication.
But the root cause could be that the lubrication schedule in your preventive maintenance program isn't frequent enough.
Other reasons include technicians not being properly trained in lubrication procedures or contamination entering the bearing housing due to a damaged seal.
Effective root cause investigation looks at three levels:
The immediate physical failure (the bearing failed),
The underlying system issue (inadequate lubrication)
An organizational or process gap that allowed the condition to develop (insufficient preventive measures or training).
Source: WorkTrek
Research shows that manufacturing facilities implementing systematic equipment failure analysis typically achieve 40-60% reductions in unplanned downtime. These results come from addressing true root causes rather than just treating symptoms.
When identifying root causes, consider all categories of potential failures:
Design issues
Material defects
Operational factors (running outside normal parameters)
Inadequate preventive maintenance
Incorrect spare parts inventory
Environmental conditions like temperature extremes or contamination.
Remember that many failures have multiple contributing factors. Your investigation should identify all significant causes, not just the most obvious one.
Develop Corrective and Preventive Actions
Once you've identified root causes, develop corrective actions that prevent recurrence and preventive actions that address similar potential failures across other equipment.
Effective corrective and preventive actions (CAPA) should be specific, measurable, and address the actual root cause.
Vague recommendations like "improve maintenance" won't drive real change. Instead, specify exactly what needs to change: update the preventive maintenance schedule, implement new training procedures, modify equipment design, or improve spare parts inventory management.
Source: WorkTrek
Your corrective actions might include:
Immediate fixes to prevent the same failure mode from recurring
Modifications to maintenance tasks or frequencies in your preventive maintenance program
Changes to operating procedures or operating conditions
Improvements to condition monitoring or sensor data collection
Updates to training programs for maintenance team members.
According to a 2025 report from SFG20, continuous improvement in maintenance practices is a top priority for organizations looking to optimize maintenance operations and reduce maintenance costs.
When developing preventive actions, think beyond the specific piece of equipment that failed. If inadequate lubrication caused this bearing failure, review lubrication practices across all similar equipment. If vibration from improper installation contributed, check installation procedures for other critical equipment.
Illustration: WorkTrek / Data: Machinery Lurication
Assign clear responsibility and deadlines for each action. Corrective actions that aren't assigned to specific people with specific timelines rarely get implemented.
Document Findings for Future Reference
Thorough documentation transforms individual failure investigations into organizational learning that drives continuous improvement.
Your failure analysis report should include:
Executive summary stating what happened and what needs to be done
Description of the failure with timeline and basic facts
Methodology used in the investigation
Identify root causes with supporting evidence
Recommended corrective and preventive actions with assigned responsibilities.
Visual documentation is particularly valuable.
Include photographs showing the failed component, diagrams illustrating failure mechanisms, charts or graphs showing relevant data trends, and timelines mapping the sequence of events.
Store your failure analysis reports where your entire maintenance team can access them. Many organizations attach reports directly to asset profiles in their CMMS, creating a comprehensive failure database for future reference.
This documentation serves multiple purposes. It provides a knowledge base that helps technicians troubleshoot similar issues faster.
Source: WorkTrek
It can also support trend analysis to identify recurring failure patterns across multiple assets, justify investments in equipment improvements or replacements, and demonstrate due diligence for regulatory compliance or warranty claims.
According to research on maintenance optimization, organizations that systematically document and learn from failure analysis see significantly better equipment reliability and lower total maintenance costs over time.
Conclusion
Equipment failure analysis is about understanding what went wrong and preventing future failures.
Every failure represents an opportunity to improve equipment reliability, reduce maintenance costs, minimize unplanned downtime, enhance workplace safety, and drive operational excellence across your organization.
Source: WorkTrek
The best practices we've covered include:
Assembling cross-functional teams
Documenting the failure site
Collecting crucial evidence
Using appropriate failure analysis techniques
Identifying true root causes
Developing effective corrective actions
Maintaining comprehensive documentation
Start applying these best practices to your next equipment failure. The investment in thorough investigation and proper documentation will pay dividends through improved equipment reliability, fewer recurring failures, and a maintenance organization that gets smarter with every failure it investigates.
Operations & Maintenance
Debunking 6 Common Myths About Industrial Maintenance
Key Takeaways:
Digitization simplifies maintenance processes.
Workers in heavy industry spend only 30–50% of their time with “hands on tools.”
Training improves employees’ confidence and improves their overall performance.
Join us as we take on six prevalent industrial maintenance myths and finally put them to rest.
These aren’t minor, harmless misconceptions.
At many companies, they’re deeply ingrained in the culture and create real operational, financial, and even safety risks.
So, read on to see which of these myths you might still believe, uncover the truth behind them, and learn how to create more productive, cost-effective, and compliant operations.
Effective Maintenance Programs are Hard to Implement
Many organizations believe that building a structured maintenance program requires major investments, downtime, complex technology, and large teams.
As a result, they either delay implementation and stay stuck in reactive mode or they attempt to roll out these sweeping changes all at once without proper planning, training, or clear goals.
Ultimately, this is why so many maintenance improvement initiatives fail to deliver sustainable results, further reinforcing the myth that effective programs are difficult to implement.
Illustration: WorkTrek / Data: MAINSTREAM Community
However, they truly don’t have to be.
The key is to remove as much complexity as possible, especially at the beginning, so the transformation doesn’t feel overwhelming.
One way to do so is by digitizing maintenance operations.
Daniel Russo, CEO of FacilityGrid, a software for streamlining building commissioning (Cx) and quality assurance/control for construction projects, agrees:
Illustration: WorkTrek / Quote: Propmodo
Here, it’s important to note that this doesn’t mean investing in the newest, most advanced AI-driven platforms or expensive condition-monitoring sensors.
A single, intuitive CMMS is often more than enough to get you started.
Take it from Cygnus Manufacturing Company, a manufacturer of industrial components.
They were able to significantly improve their operations without overburdening the team, all thanks to WorkTrek CMMS.
Ashley M. Stadelmaier, Production Planning & Procurement Specialist at Cygnus Manufacturing Company at the time, explains:
Source: WorkTrek
WorkTrek centralizes all maintenance-related information and activities in one easy-to-navigate system, including asset data, spare parts tracking, SOPs, invoices, work orders, and more.
Preventive maintenance, the backbone of any effective maintenance program, becomes easy to track, plan, and manage, too.
You simply create a recurring work order, define triggers (time-based or meter-based), set the planned duration and end rules, and assign it to appropriate personnel.
Source: WorkTrek
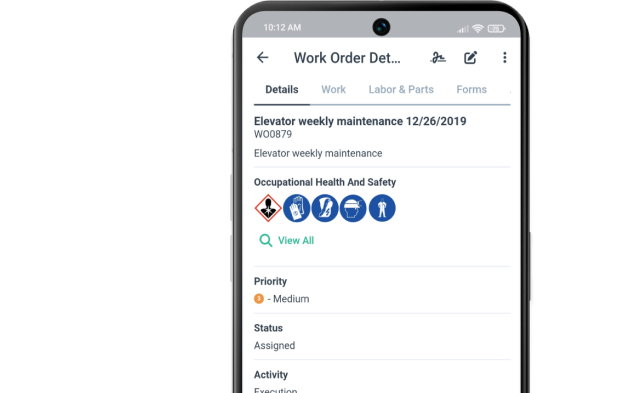
When it’s time to complete the task, the assigned technician receives a notification.
They can access the work order directly from their phone, complete with problem descriptions, locations, required spare parts, PPE requirements, photos, and step-by-step instructions.
Source: WorkTrek
Once the work is complete, they can close the work order on the spot, add comments, sign off, and request feedback.
No paperwork, no unnecessary office trips, and no chasing down vital information.
With WorkTrek, getting started with a solid maintenance program is easy for everyone involved, from supervisors and managers to technicians themselves.
More People Equals Fewer Problems
When downtime increases, backlogs grow, or response times decrease, the instinctive reaction is to add headcount.
At first glance, that makes sense: if work isn’t getting done fast enough, more technicians must be the answer.
Now, debunking this myth is somewhat tricky because there is some truth to it.
After all, manufacturing is currently experiencing a labor shortage and is struggling to find enough workers to keep operations running smoothly.
Chad Moutray, former Director of the Center for Manufacturing Research at The Manufacturing Institute, notes:
Illustration: WorkTrek / Quote: Manufacturing Dive
Therefore, for some companies, this isn’t a myth at all. Adding workers would truly solve some of their issues.
The key point, however, is to avoid treating “we need more people” as the default explanation whenever work slows down.
Remember, breakdowns and downtime are obvious, but inefficiencies in planning, scheduling, and coordination are not.
In those cases, hiring more people only treats the symptom rather than the root cause.
Recent McKinsey research even provides some compelling data to support this.
In most heavy-industry companies, workers spend only 30–50% of their time actually performing productive tasks.
Illustration: WorkTrek / Data: McKinsey & Company
That means labor is often underutilized, and adding more workers can’t solve that problem.
It can only increase costs without improving your operations.
Therefore, before you start hiring, take a hard look at your current operations and see if there are any areas for improvement.
Maybe the work isn’t properly prioritized, or work orders aren’t as easily accessible as you thought.
Maybe spare parts are being underordered, forcing technicians to waste time waiting for them rather than doing the actual work.
The list of potential issues goes on and on.
That’s why it’s so important to, before you decide to add technicians, make sure you’re adding them to a system that already works, rather than using them to compensate for one that doesn’t.
Techs Will Learn It on the Job
In industrial settings, there seems to be a belief that workers will naturally pick things up by being on the floor, watching others, and learning from failures as they happen, so formal training isn’t needed.
Part of the reason this belief exists is that maintenance culture has long relied on tribal knowledge: informal, unwritten know-how held in the heads of experienced employees.
Billy Daniel, Training Supervisor at Holtec International, an American supplier of equipment for the energy industry, explains why relying on this kind of knowledge isn’t sustainable:
Illustration: WorkTrek / Quote: LinkedIn
That’s when new technicians are left on their own.
Over time, this creates unsafe habits and can lead to costly mistakes that put critical equipment and everyone’s safety at risk.
That’s why structured training and mentorship beat trial and error any time.
According to SurveyMonkey, employees themselves agree.
Illustration: WorkTrek / Data: SurveyMonkey
After all, most of them don’t want to do a bad job and understand that learning through experience alone isn’t enough.
What they need is structured training, mentoring, clear documentation, and deliberate practice.
Manufacturing companies that recognize this reap significant rewards.
Deloitte reports that organizations that prioritize skill development are better at anticipating change, retaining top talent, and driving innovation, along with many other benefits.
Illustration: WorkTrek / Data: The Manufacturing Institute
In short, investing in proper training can be a major driver of resilience and long-term success for manufacturing companies.
Yes, tribal knowledge can be valuable, but it works best when it’s supported by structured education.
Cutting Maintenance Costs Will Increase Profitability
Unfortunately, maintenance is still often viewed as just a cost center and a necessary evil, rather than a function that delivers real value to a manufacturing company.
As a result, when financial pressure hits, maintenance budgets are seen as easy targets because the savings are immediate and highly visible.
On paper, that reduced maintenance spending may appear to improve profit margins.
In reality, however, these cuts do cause harm, at first quietly, but eventually in serious and costly ways.
One of the most obvious consequences is unplanned downtime, which can cost industrial businesses an average of $125,000 per hour.
Illustration: WorkTrek / Data: ABB
When maintenance teams lack adequate resources, they tend to adopt a reactive culture and are unable to identify minor issues or wear and tear.
These problems then escalate quickly into major, unpredictable machine failures that disrupt operations and cause stoppages in industries where virtually every minute counts.
However, the impact can go even deeper.
Poorly maintained machinery often operates below optimal precision, leading to higher rates of defective, deformed, or substandard products.
In some cases, this can lead to product recalls, which can cost manufacturers anywhere from $10 million to $49.99 million.
Illustration: WorkTrek / Data: ETQ
The risk of noncompliance is also significant in heavily regulated industries.
There are now many mandatory standards governing the inspection, repair, and upkeep of assets to ensure safety, efficiency, and environmental protection.
Neglecting maintenance goes against them and can have serious consequences.
As Shawn Knowles, SVP and Director of Risk Engineering at MSIG, a commercial insurance provider, explains:
“[Risks] include loss of competitive advantage in the market, financial penalties [...], product recalls [...], loss of revenue, and legal ramifications where the manufacturer could face expensive lawsuits by not complying.”
All in all, while cutting maintenance spending may seem appealing at first glance, decision-makers must recognize the risks they are creating by doing so.
Maintenance is a vital part of manufacturing operations and serves as a safeguard against significant operational, financial, and legal issues.
As such, it’s well worth the investment.
Making a Machine Work and Fixing It Is the Same
To some managers, if the machine is running, it’s fixed. And that’s the only thing that matters.
Production is happy, the line is moving, and the pressure is off, so the job must be done.
This Reddit thread shows just how prevalent and harmful this mindset really is:
Source: Reddit
Unfortunately, in manufacturing, speed of repair is often valued far more than quality.
Operations tend to prioritize getting the line running now, hitting today’s targets, and avoiding missed shipments.
This creates an environment where temporary restoration is rewarded more than permanent correction.
The previous myth we covered, that cutting maintenance costs is a great way to save money, plays a role here as well.
As one Redditor put it:
“No matter how detailed I try to sell a needed repair, they always seem to find an outside resource to shoot me down. Management people show that they saved money in budget meetings are considered gods, and the creeps in maintenance are clueless.”
The frustration on the technicians’ side is completely justified.
In a way, they’re being prevented from doing their jobs properly, and they understand exactly how damaging that is to the equipment and to overall operations.
Not to mention the severe impact on safety.
A 2024 Vector Solutions survey showed that many industrial workers believe their equipment is outdated and poorly maintained.
Nearly half also reported experiencing a safety incident at their facility within the previous year.
Illustration: WorkTrek / Data: Vector Solutions
Taken together, these facts form a clear picture: neglecting equipment creates an unsafe, inefficient, and unproductive work environment.
That’s exactly why this myth is so harmful.
More Advanced Machinery Is Always Better
In industrial environments, new, advanced machinery is constantly emerging, promising more speed, quality, and control than ever before.
It’s only natural for some to fall into the trap of thinking these machines will automatically improve performance while requiring less maintenance.
However, they fail to realize that such equipment often demands higher skill levels, specialized parts, and additional training.
In an industry where training is already neglected, as we discussed earlier, these machines can further complicate matters.
Daniel Marchant, Service Manager at Xylem, a large American water technology provider, agrees:
Illustration: WorkTrek / Quote: The State
Put simply, without proper training, technicians cannot maintain these assets efficiently.
So, when problems occur with this new equipment, operations slow down, and you experience productivity loss, decreased asset utilization, and even potential difficulties obtaining spare parts.
Not a very good ROI, is it?
McKinsey has done some research on the correlation between productivity losses and task complexity in manufacturing environments, and what they found debunks this myth further.
As it turns out, as task complexity increases, productivity gaps between higher-skilled and lower-skilled performers can grow by up to 800%.
Illustration: WorkTrek / Data: McKinsey & Company
In other words, if your workforce isn’t equipped to handle complex machinery, inefficiencies and losses are inevitable.
So, rather than assuming that the newest or most advanced equipment is always the best, consider focusing on finding the right machines for you.
Those are the ones that align with your processes, workforce capabilities, and budget.
Conclusion
The reason all these maintenance myths persist for so long is that they feel intuitive, almost logical.
Of course, it’s more profitable to cut upkeep costs.
Of course, hiring more people should make us more productive.
But as this article has shown, relying on intuition and guesswork doesn’t always work.
In fact, sometimes it can cause even more damage.
So, before making any final decisions, always evaluate operations objectively, relying on cold, hard data, and try to involve actual technicians in the decision-making process.
They are the ones who understand what’s really happening on the floor and are often best positioned to determine the right course of action for maintaining smooth production and long-lasting, safe assets.

Operations & Maintenance
Different Methods of Documenting Maintenance
Key Takeaways:
Paper-based maintenance logs are cheap and simple but prone to damage, loss, and inconsistent records.
Nearly 50% of organizations used spreadsheets as their primary maintenance tracking method in 2022.
Two-thirds of organizations now use a CMMS for centralized, automated, and real-time maintenance tracking.
How your team documents maintenance work can make all the difference between a quick repair and hours of downtime spent searching for information that should have been easy to find.
Yet many facilities still rely on methods that create more problems than they solve.
If you manage maintenance operations and struggle with lost records, inconsistent data, or difficulty tracking asset history, this guide is for you.
In this article, we’ll compare common maintenance documentation approaches and help you identify which method best fits your needs.
Paper-Based Maintenance Logs
Let’s start with one of the simplest documentation methods: paper-based maintenance logs.
This is a traditional approach that some teams still use, though it’s becoming increasingly rare as digital tools become more widely available.
In fact, you'll typically find paper logs in smaller facilities or operations that haven't yet made the switch to digital systems.
Maintenance teams often record their notes on a structured template like the one shown below.
Source: Templatelab
Printable maintenance templates like these help ensure every key detail is accounted for, and nothing is accidentally missed.
Otherwise, workers must take notes on blank sheets or in notebooks, which can lead to inconsistent records.
One technician might record the maintenance date and asset name, while another might skip those details entirely.
Structured templates solve this problem by prompting workers to fill in specific fields every time.
However, even with this structure, this is a fairly low-tech documentation method.
As such, paper logs will have their fair share of disadvantages.
We’ve outlined some specific pros and cons in the table below.
ProsConsLow upfront costProne to damage, loss, and illegible handwritingSimple to start, no training requiredCannot search or analyze historical data quicklyUseful as initial notesNo reminders or schedulingKnowledge leaves when key workers retire
Of course, the pros are the simplicity and low cost of this approach. You don't need software, subscriptions, or even an internet connection.
Anyone can pick up a pen and start writing immediately.
Additionally, paper logs can sometimes be useful in the field as initial maintenance notes.
A technician working on equipment might jot down observations quickly, just in case they forget important details before returning to a computer.
That being said, even in these situations, one of the main issues is that notes can be illegible due to handwriting or get damaged by water, oil, or general wear.
When that happens, the information becomes useless.
Plus, there are other reasons why paper records aren’t the best choice, such as inefficient data retrieval:
“Paper records can only be in one place at a time, often requiring team members to wait for access or rely on photocopies.”
You’ll also need hours of manual work if you want to search through historical data or identify patterns across multiple assets.
There's no way to search, filter, or generate reports automatically.
And here's perhaps the worst part.
Say an experienced employee has developed a certain system for organizing maintenance logs, or they write notes in a way that only they truly understand.
If they leave or retire, that knowledge goes with them.
As a result, the team inherits records that are often incomplete or difficult to decipher.
Overall, paper-based logs are simple and cheap to implement, but they come with significant limitations in reliability, accessibility, and long-term usefulness.
For most facilities looking to grow or improve their maintenance operations, paper logs should be considered a temporary solution at best.
Spreadsheet-Based Maintenance Records
Spreadsheet-based maintenance logs are a step up from their paper-based counterpart.
You’re likely familiar with this digital maintenance tracking method and may currently be using it or have used it in the past.
In fact, a lot of organizations use spreadsheets to track maintenance activities.
That certainly was the case in 2022.
Comparesoft data from that year shows that almost half of the organizations surveyed used spreadsheets as their main maintenance management system.
Illustration: WorkTrek / Data: Comparesoft
This suggests that they are generally quite effective, doesn’t it?
Well, if we contrast that figure to the findings in the 2024 State of Maintenance Report by Upkeep, we can see that spreadsheet usage, along with the use of paper logs, has dropped to 27%.
That's a noticeable decline in just two years.
To explain this drop in usage, it helps to look at the advantages and disadvantages of this documenting method:
ProsConsFlexible structure, easy to customizeVersion control issues with multiple usersBasic sorting and filtering capabilitiesManual data entry leads to errors and inconsistencyCan create simple charts and reportsNo automation, alerts, or real-time updatesSingle source of truthNot scalable
For starters, the benefits are definitely there.
Spreadsheets are low-cost, versatile tools that can be tailored to many specific maintenance workflows and use cases.
Plus, simple filters along with charts and reports can transform raw data into simple reports, although some tech know-how is necessary.
Having everything in a centralized file also allows teams to have a single source of truth for work orders, asset history, parts usage, and other relevant maintenance-related details.
When done well, a spreadsheet can keep a small team organized and on track.
However, issues can still arise.
What happens when multiple workers update the same spreadsheet, or when team members have separate spreadsheets that they want to consolidate?
These version control issues are a big concern.
Source: WorkTrek
One technician might update their copy of the file while another technician does the same, and suddenly you have two versions with different information.
Worst of all, neither person knows which version is correct.
Cloud-based tools like Google Sheets help reduce this problem, but they don't eliminate it entirely, especially when edits happen simultaneously or when users forget to refresh their view.
Next, spreadsheets require manual updates and data entry from maintenance teams.
Every work order, every inspection, every parts replacement needs to be typed in by someone.
A technician might enter a date in the wrong format, misspell an asset name, or forget to log a completed task altogether.
These small mistakes add up over time.
And importantly, this manual approach is simply not scalable if operations grow. What works for a facility with 50 assets becomes overwhelming when that number reaches 500.
So, while spreadsheets work well as a starting point, they often become a bottleneck as maintenance operations become more complex.
Messaging-Based Documentation
Messaging can also be used for maintenance documentation, though it generally falls short of the structure provided by spreadsheets.
Some teams rely on email communication to track requests and document maintenance work.
A technician might email their supervisor when a repair is completed, or a manager might forward a maintenance work request to the appropriate team member.
Such an email can be fully unstructured, with just a few sentences describing the issue, or it can follow a more structured approach, like the example below.
Source: WorkTrek
While a step up from paper logs, it still has its shortcomings.
Email avoids issues like illegible handwriting and physical damage to records.
However, as stacks of paper maintenance notes can be overwhelming, a full inbox can quickly become just as chaotic.
As Kristen Griffith, Senior Manager of Corporate Communications at PTC, explains, teams easily get overwhelmed when requests and reports all go through email.
Illustration: WorkTrek / Quote: PTC
Work orders can get buried among other emails, while reports from workers can get lost and become difficult to retrieve by management.
Important details end up scattered across dozens of message threads, making it nearly impossible to build a clear maintenance history for any single asset.
On top of that, there is no easy way to track whether a request has been completed or is still pending.
A more structured alternative is using communication and collaboration platforms like Slack or Microsoft Teams, or even specialized, custom-built tools.
These tools can help by organizing conversations into dedicated channels for different equipment, locations, or maintenance types.
Source: Slack
For example, a team might create a channel specifically for urgent repair requests and another for routine inspections.
This keeps related messages together and makes searching easier than digging through a general email inbox.
Some teams also use built-in features like pinned messages or task integrations to track open items.
However, these platforms still lack core functions of maintenance management software like automated scheduling, asset tracking, and reporting.
Before we move on to dedicated maintenance management software, let's summarize the pros and cons of this method:
ProsConsFast and convenient for quick requestsInformation scattered across inboxes or chat threadsMost workers already use email or chat dailyDifficult to search for specific maintenance historyAllows photo and file attachmentsNo structure for tracking work order statusGood for urgent communicationPoor accountability, easy to miss or forget requests
In short, messaging-based documentation offers convenience and speed, but it falls short when it comes to organization, accountability, and long-term record keeping.
For teams that need reliable maintenance history and clear tracking, this method should only serve as a supplement to a more robust system.
CMMS
Speaking of more robust systems, the best choice when it comes to documenting maintenance is using a Computerized Maintenance Management System, or CMMS.
These systems are purpose-built for this exact function and are the most effective way to document, track, and manage maintenance activities.
It's no wonder that, according to UpKeep’s research, two-thirds of organizations now use a CMMS.
Illustration: WorkTrek / Data: UpKeep
If we look at the table below, it’s clear to see why, as the advantages of these systems far outweigh any cons.
ProsConsCentralizes all maintenance data in one placeRequires upfront investment and implementation timeAutomates scheduling, reminders, and reportingLearning curve for teams new to the softwareEnables trend analysis and data-driven decisionsSome features may go unused without proper trainingScales easily as operations grow
In essence, after an implementation period and some training, you get a centralized system that holds all your maintenance data.
But more than that, powerful CMMS platforms like WorkTrek allow teams to capture maintenance data in real time and automate documentation.
This eliminates the delays and gaps that come with manual methods and unspecialized tools like spreadsheets.
It all starts with structured work log entries that can be easily filled out by maintenance workers, with the customizability to track everything that's necessary for your operations.
Source: WorkTrek
In fact, with custom forms and checklists, you can ensure the right data is collected every single time.
This consistency makes your maintenance records far more reliable and useful for analysis later.
All of these entries can be recorded via a mobile device and instantly synced with the central system.
So, a technician can complete a work order on their phone while still at the equipment, and that information will be instantly available to supervisors and other team members.
Plus, with automation, WorkTrek can create follow-up work orders for any inspections marked as failed or flagged for attention.
The flexibility and benefits are substantially different from all the other methods we've covered.
Not to mention that, with the wealth of data collected in the system, you can easily generate detailed reports and track progress over time, enabling better decision-making at every level of maintenance operations.
Source: WorkTrek
Therefore, it’s not surprising that, according to McKinsey, leading organizations rely on digital tools like these to improve operations and reduce downtime.
Illustration: WorkTrek / Quote: McKinsey
After all, a CMMS offers the most complete and scalable solution for maintenance documentation and management.
While it requires an initial investment of time and resources, the long-term benefits in efficiency, accuracy, and visibility make it the clear choice for facilities serious about growth and scaling.
Conclusion
Each maintenance documentation method we covered has trade-offs in cost, scalability, and data reliability.
While there are some more obvious choices on this list, you should still use the information we provided to understand which approach matches your facility's size and goals best.
Consider evaluating your current system against the criteria discussed here, then decide whether upgrading your documentation method could reduce downtime and improve your team's efficiency.

Operations & Maintenance
Here’s How to Build a Lean Maintenance Process
Key Takeaways:
Hebei Jiheng Pharmaceutical Company used CBM to cut maintenance costs by 40%.
Companies cannot unlock stable maintenance processes without process mapping.
Excessive PM can drain time, money, resources, and slow down production.
Have you ever wondered why some maintenance teams are stuck in a reactive, firefighting mode while others run seamlessly, with fewer breakdowns and lower costs?
You might be surprised to learn that the difference isn’t the size of the budget or the sophistication of the tools and technology.
It’s the process behind the work.
In many organizations, maintenance is weighed down by reactive tasks, wasted motion, excess inventory, and unclear priorities.
Downtime eats into productivity, technicians feel stretched thin, and small issues snowball into costly failures.
That’s where lean maintenance comes in.
It focuses on eliminating all kinds of waste, improving flow, and making maintenance a value-driving function rather than a necessary evil.
In this article, you’ll learn how to build a lean process in seven steps, so you can unlock these amazing benefits within your own operation.
1. Communicate the Vision
Before making any changes, ensure that everyone, from leadership to frontline technicians, understands what lean maintenance is and why it matters.
Explain how reducing waste can make their jobs easier, improve equipment reliability, and contribute to the company’s overall success.
People are naturally skeptical of change, so communicating these benefits clearly will increase the likelihood of company-wide buy-in and a successful lean implementation.
Tony Di Tullio, Director of Property Management at Air Canada, Canada's largest airline, agrees:
Illustration: WorkTrek / Quote: FacilitiesNet
Di Tullio explains that the best way to do this is by winning over the naysayers first.
If you can get one or two of them on board, momentum will build quickly.
He also stresses the importance of clearly explaining how the new program will work, what will change, and what employees stand to gain.
A strong presentation should clearly answer questions such as:
Why are we changing now?
What problems are we solving?
What does “better” look like?
How will this help me in my role?
How will success be measured and sustained?
Don’t forget to tailor the message to different audiences.
Executives will want to understand ROI, risk reduction, and the overall business impact.
Supervisors will be focused on workload stability, planning efficiency, and execution.
Technicians, on the other hand, will want to know how their day-to-day work will change and how the program will affect safety, downtime, and overall efficiency.
Boeing, a company that achieved significant results through lean, also began by clearly sharing the vision.
Scott Stocker, VP and General Manager of the 787 Program, explains:
Illustration: WorkTrek / Quote: Boeing
By doing this, the vision becomes tangible and believable, helping justify the change and ensuring long-term success.
2. Map Your Current Processes
Next, choose a key maintenance process, such as your work order management workflow or preventive maintenance program, and document its end-to-end flow.
Remember, you cannot improve what you do not understand.
This step helps expose hidden waste, bottlenecks, and variation, and prevents you from “fixing” the wrong problems based on assumptions.
Ricky Smith, VP of World Class Maintenance, a corporate maintenance training provider, stresses the importance of process mapping:
Illustration: WorkTrek / Quote: UpKeep on YouTube
Essentially, mapping your current processes means visually documenting how maintenance work truly flows today, from the moment an issue is identified to the moment the work order is closed.
The goal is not to design the ideal future state yet, but to fully understand the current one, including all delays, rework, handoffs, and variations.
This typically includes mapping:
How work is requested
How work is approved, planned, and scheduled
How parts, tools, permits, and resources are obtained
How work is executed, documented, and closed
How feedback and failure data are captured or lost
Be sure to involve technicians and planners in this process to capture the real state of things.
They perform the work every day and know where time, effort, and information are lost.
Once you understand all the steps and interactions, depict the process visually.
One commonly used tool is a swimlane diagram, a visual flowchart that maps a process while showing who does what and when, as shown below.
Source: WorkTrek
This clarifies roles, handoffs, and responsibilities.
Another option is a Value Stream Map (VSM), a lean management tool that visually maps every step of a process to identify waste and improve efficiency by showing both material and information flow.
Once your processes are fully mapped, you will have a solid baseline for improvement, revealing opportunities for optimization in an objective and structured way.
3. Eliminate Waste
This step is the core of lean maintenance.
It involves identifying and eliminating activities that do not add value to the maintenance process or the organization.
It’s important to remember that waste can take many different forms and affect various aspects of maintenance.
One acronym commonly used to help remember these types of waste is DOWNTIME:
Defects
Overproduction
Waiting
Non-utilized talent
Transportation
Inventory
Movement
Excess processing
However, that is just one way to categorize waste in lean maintenance.
Another commonly used approach is the 5 Ms framework:
Man (Workforce)Waste related to human resources, including underutilized skills, lack of training, inefficient movement, safety hazards, and poor communicationMachine (Equipment)Waste associated with equipment, such as downtime due to breakdowns, inefficient operation, underutilization, and inadequate maintenanceMaterial (Spare Parts & Supplies)Waste related to materials, including excess inventory, stockouts, obsolete parts, inefficient procurement processes, and poor storage practicesMethod (Maintenance Processes & Procedures)Waste is embedded in how maintenance work is performed, such as inefficient workflows, lack of standardization, unnecessary steps, and inadequate documentationMeasurement (Data & Analysis)Waste caused by poor data-driven decision-making, inaccurate performance metrics, and the inability to identify, measure, and track improvement efforts
It doesn’t really matter which framework you choose for your operations, as they are all very similar and focus on the same underlying issues.
What does matter, however, is avoiding the mistake of trying to tackle all waste at once.
Instead, work with your team to identify the single largest source of waste and address that first.
For many organizations, this is often the planned maintenance program, due to a common misconception that more maintenance automatically leads to better results.
In reality, excessive maintenance can be a significant source of waste, says Charles Rogers, Senior Implementation Consultant at Fiix Software:
Illustration: WorkTrek / Quote: Fiix
Preventive maintenance can indeed drain time, money, resources, and even slow down production.
So, here’s what to do instead.
4. Introduce Condition-Based Maintenance
Lean maintenance is less about time-based schedules and more about using real asset condition data to trigger work.
This approach, known as condition-based maintenance (CBM), relies on monitoring key indicators of asset health, such as vibration or oil quality, to determine when maintenance is actually needed.
Martin Thomson, Senior Manager of Digital Services at Schneider Electric, a French multinational specializing in digital automation and energy management, explains it well:
“Think of [CBM] like keeping a ship on track. If you wait until you’re way off course, […], and then try to correct, that’s inefficient. But if you’re constantly checking your course from day one, you get there faster, and you make your equipment last longer.”
In other words, the goal is not to follow a fixed, static schedule, but to continuously fine-tune maintenance plans based on an asset’s real condition and usage, which change constantly.
By doing so, companies prevent both under-maintenance, which can lead to major failures, and over-maintenance, which wastes time and resources.
The result is significantly improved asset reliability and availability.
Take it from Hebei Jiheng Pharmaceutical Company, which used CBM to cut downtime by 50% and maintenance costs by 40%.
Illustration: WorkTrek / Data: ABB
Thanks to this strategy, the factory can now operate at full capacity, maximizing revenue without adding extra assets, personnel, or other resources.
For organizations just starting with condition-based maintenance, it’s best to begin gradually.
There’s no need to monitor every asset or invest immediately in the most advanced technology.
Instead, focus on a small number of critical assets and use user-friendly, cost-effective IoT sensors.
As your team gains experience and the benefits of CBM become evident, you can scale the program over time.
5. Standardize Work
Next, it’s time to define and document the best-known method for performing each maintenance task, so it can be executed consistently, safely, and efficiently every time.
This includes not only the task itself, but also all supporting elements, such as tools, parts, safety precautions, approvals, and documentation.
So, when developing your SOPs, consider including the following elements:
Purpose & ScopeWhy the SOP exists and which specific equipment or tasks it coversRoles & ResponsibilitiesWho performs the task, who supervises it, and who provides approvalRequired ResourcesA complete list of tools, parts, software, and personal protective equipment Step-by-Step ProceduresClear, sequential instructions, ideally supported by visuals such as diagrams or photosSafety PrecautionsCritical warnings, PPE requirements, lockout/tagout steps, and hazard identificationQuality ControlAcceptance criteria or checkpoints to confirm the work has been completed correctlyDocumentation & ReportingInstructions for recording task completion, findings, or issues (for example, in a CMMS)Troubleshooting & Emergency ActionsGuidance for handling unexpected issues or breakdowns
This may seem like a lot of information, but when it comes to process standardization, being thorough matters.
It reduces variation, one of the biggest contributors to defects, safety risks, and rework, and creates a stable foundation for continuous improvement.
Ultimately, when work is standardized, maintenance is performed correctly and consistently, thereby minimizing unexpected downtime and wasted effort.
However, even the best SOPs are ineffective if they are difficult to find or access.
If procedures are scattered across paper documents in an office, technicians, particularly those who work in the field, are unlikely to take the time to search for them.
Abid Sulayman, Business Process Improvement and Automation Specialist at Autotek.io, a provider of digital solutions for the automotive industry, suggests a better approach:
Illustration: WorkTrek / Quote: LinkedIn
Put simply, digitize your SOPs.
By centralizing and making them accessible anytime and anywhere, you significantly increase the likelihood of compliance.
Instead of wasting time searching for instructions, technicians can pull them up on their phones, see exactly how to perform the task, and get to work immediately.
6. Streamline Workflows with Automation
Following all the steps outlined in this guide without automation would be difficult, if not downright impossible.
After all, manual processes are extremely time-consuming, prone to errors, and hard to scale.
In fact, research shows that most people abandon manual maintenance management due to functional limitations, inefficiency, and poor user experience.
Illustration: WorkTrek / Data: Gartner
Lean maintenance is all about minimizing waste and inefficiency, which makes automation a logical step in implementing a successful lean program.
To better understand how lean and automation go hand in hand, take a look at WorkTrek.
This CMMS centralizes all maintenance data, reduces repetitive tasks, and improves visibility across operations through its core features:
Work Order ManagementCreate, assign, track, and prioritize WOs from anywhere. Capture key details with customizable required fields.Work Request ManagementSubmit requests through multiple channels: app, email, or request portal. Automatically notify stakeholders of updates, and collect feedback once work is completed.Asset ManagementRecord and update all asset information, including physical location, performance history, warranties, maintenance logs, and costs.Inventory ManagementTrack parts using barcodes or QR codes to reduce manual entry. Receive automated low-stock alerts to avoid delays.InvoicingGenerate invoices from work orders in just a few clicks. Minimize errors by pulling accurate data directly from completed tasks.AnalyticsUnlock insights into your business with reports, KPIs, metrics, and customizable dashboards
Most importantly, WorkTrek automates preventive maintenance (PM) scheduling.
You can set up recurring work orders with assigned personnel, priority levels, SOPs, checklists, photos, and instructions.
Scheduling can be based on time (daily, monthly, etc.) or usage metrics such as mileage, hours, temperature, or pressure.
Source: WorkTrek
This allows you to maintain assets proactively, ensuring they receive the care they need, when they need it.
Additionally, WorkTrek automatically generates follow-up work orders after failed inspections, keeping assets in peak condition with minimal downtime.
Overall, automation makes maintenance work easier, faster, data-driven, and strategic.
This aligns perfectly with lean principles, which prioritize waste reduction and help workers focus more on value-added activities.
7. Create a Continuous Improvement Loop
In lean maintenance, work is never truly complete.
Performance must be continuously reviewed, failures should be treated as learning opportunities, and incremental improvements should be made consistently.
That’s how you prevent stagnation.
Assets, technology, and business conditions are constantly evolving. Continuous improvement ensures the maintenance program evolves along with them.
Scott Stocker from Boeing implemented this mindset, too, and offers this advice:
“Promote Lean thinking as an ongoing process rather than a one-time initiative. […] Establish regular performance review and feedback mechanisms to track progress and make step-by-step improvements.”
Before conducting performance reviews, however, start by outlining clear KPIs to measure success.
Without them, you risk trying to track everything at once, which can be overwhelming and provide little actionable insight.
Clear, predefined KPIs, on the other hand, help maintain focus and consistency over time.
Begin with just a few relevant metrics, such as:
Mean Time Between Failures (MTBF)Measures how often equipment fails, highlighting areas needing reliability improvementsMean Time to Repair (MTTR)Tracks the average time taken to fix an asset, indicating maintenance efficiencyPlanned Maintenance Percentage (PMP)The proportion of scheduled versus reactive maintenance; higher PMP reflects a proactive approachMaintenance Cost as a Percentage of RevenueEnsures maintenance spending aligns with business goals and is not excessive
As your program matures, you can add more KPIs as needed.
Additionally, if you use a CMMS or similar solution, remember that the system automatically tracks and analyzes many of these metrics.
Often, accessing these reports is just a few clicks.
Then it’s all about putting what you’ve learned into action.
Conclusion
When implementing lean maintenance, don’t expect everyone to get everything right the first time.
You will almost certainly encounter skepticism, misunderstandings about new roles or processes, and mistakes or inconsistent execution.
That’s completely normal. Lean takes time to fully take hold.
In fact, when people are asking questions and pointing out what isn’t working, it’s a sign they’re engaging with the process rather than ignoring it, which is exactly what you want.
So, expect variability early on and normalize mistakes.
Treat errors as opportunities for improvement, not as evidence that the implementation is failing.
Over time, this way of working will become the new normal, delivering the benefits you’ve been working toward.

Operations & Maintenance
Importance of Lean Maintenance: Our Take
Key Takeaways:
Honda, GE, Boeing, and Toyota all use lean maintenance to increase productivity.
64% of consumers wish companies would respond faster to their needs.
The majority of consumers will abandon a brand for a better-quality alternative.
The main goal of lean maintenance is to make upkeep processes smarter, faster, and more cost-effective.
In short, it makes them better.
But how does it actually work, and why should companies even care?
That’s exactly what this article sets out to uncover.
We’ll not only break down the benefits of lean maintenance, but also explore real-world examples of industry leaders that have put it into practice and reaped impressive results.
Ready to see what lean maintenance can really do?
Let’s begin.
Eliminates Waste in Maintenance Processes
Lean maintenance focuses on identifying and eliminating non-value-added activities in maintenance work, such as:
Waiting for spare parts, permits, or approvals
Unnecessary preventive maintenance
Excess motion (searching for tools, poor layout)
Rework due to poor repairs or lack of standards
These activities can consume significant time, money, and resources without improving asset reliability or performance.
They are more than just unnecessary. They are pure waste.
Take missing tools, for example.
According to Michael McGowan, Region Head and CEO of Hilti North America, a provider of tools, software, and services for the construction industry, searching for tools can be extremely time-consuming:
Illustration: WorkTrek / Quote: For Construction Pros
That’s one full day not spent doing actual value-adding work.
Lean maintenance seeks to eliminate such inefficiencies, boosting a company’s productivity and agility.
Few organizations exemplify lean thinking better than Toyota, the pioneer of lean maintenance and manufacturing.
In 2025, Toyota updated its lean model by integrating digital tools to strengthen EV readiness and increase operational agility in an increasingly turbulent global landscape.
One key change was the implementation of digital twin technology, which simulates production flows, anticipates bottlenecks, and optimizes layouts, reducing even the need for physical travel.
Kevin Anderson, Toyota Senior Manager of Production Engineering, explained:
Illustration: WorkTrek / Quote: Automotive Manufacturing Solutions
In short, this technology allows Toyota to plan work and allocate resources more strategically.
Alongside digital twins, Toyota also introduced predictive maintenance powered by IoT sensors and machine learning.
This system anticipates equipment failures, significantly reducing unplanned downtime and maintenance costs.
In fact, their AI platform is projected to save 10,000 hours of manual work annually, freeing employees to focus on higher-value problem-solving.
Illustration: WorkTrek / Data: Automotive Manufacturing Solutions
With this updated lean model, Toyota wastes less time, less money, and fewer resources.
It enables the company to produce more with existing assets, reduce risk, and reinvest savings into innovation and growth rather than constant firefighting.
Improves Equipment Uptime
Lean maintenance improves asset reliability and availability by prioritizing planned and condition-based upkeep, along with more strategic, efficient scheduling.
Such a proactive approach works because it addresses potential problems and major failure risks before they escalate into costly disruptions.
In fact, research shows that preventive maintenance is the primary strategy most manufacturing businesses use to reduce downtime.
Illustration: WorkTrek / Data: Limble
To ensure efficient execution of planned maintenance, lean experts typically rely on computerized maintenance management systems (CMMS).
These digital platforms centralize maintenance data, supporting strategic planning and safe and efficient execution of maintenance tasks.
Take it from interEnergo, an international energy company based in Slovenia.
Before implementing a CMMS, their maintenance data was scattered across Excel files and various documents, and they depended heavily on individuals to perform tasks on time.
This often led to mistakes, power plant shutdowns, and reduced asset uptime.
However, all that changed after they implemented WorkTrek CMMS, explains Matjaž Valenčič, Operations & Maintenance Manager at interEnergo:
“WorkTrek gives us complete control over all maintenance activities on our assets so we can ensure that our energy plants and devices are safe and operate reliably, and in this way we achieve the desired return on investment.”
WorkTrek’s preventive maintenance feature allows them to create and schedule maintenance templates that include SOPs, checklists, photos, detailed instructions, and more.
These templates use customizable required fields, which means no work order can be submitted until all critical information is entered.
Source: WorkTrek
This ensures technicians have everything they need to perform their work safely and efficiently.
The platform also offers flexible scheduling options.
Users can choose time-based or meter-based triggers (such as temperature, mileage, or usage hours) and define planned durations and end rules.
Source: WorkTrek
When maintenance is due, the assigned worker receives a notification.
As a result, each asset receives timely care based on its actual needs, eliminating the risk of over-maintenance, under-maintenance, or missed tasks altogether.
The outcome is longer-lasting equipment, fewer breakdowns, and higher asset availability and productivity.
Reduces Lead Times
With lean maintenance, you don’t just improve task planning. You complete the work itself faster and more efficiently.
That’s because lean strategies emphasize clear prioritization and standardized workflows.
Workers know exactly what to do, when to do it, and how to do it, with a shared understanding of which assets and activities are most critical and which can take a back seat.
Few organizations understand the importance of this better than GE.
Its gas turbines are deployed around the world, and each requires regular maintenance that often forces power plants offline for weeks at a time.
Naturally, this makes careful planning essential to minimize disruption and restore operations as quickly as possible.
By applying lean principles, GE achieved exactly that, cutting the time required to replace a critical turbine component from 25 hours to just 13.
Illustration: WorkTrek / Data: GE
GE also digitized its SOPs and best practices, making them easily accessible and consistently reproducible across all facilities worldwide.
This initiative delivered a 20%–25% reduction in cycle time for core work.
As a result, outages that once lasted six weeks can now be completed in as little as four.
As Jeremiah Smedra, Operations Director at FieldCore, GE Gas Power’s field services unit, explains:
“By using lean management and simplifying our procedures, we put information in the hands of those doing the work, with an increased focus on safety and quality. This marks a massive shift from previous field practices, leading to continuous improvements in safety, quality, delivery, and cycle time.”
For power plant operators, these improvements mean getting back online faster, allowing them to produce power sooner, deliver electricity reliably, and generate revenue more quickly.
In short, faster repairs mean less disruption, greater agility, and a stronger ability to respond to customer needs.
That matters more than ever.
According to a 2022 Accenture survey, most consumers want companies to respond to their needs more quickly.
Illustration: WorkTrek / Data: Accenture
Lean maintenance helps organizations do exactly that, speeding up upkeep and ensuring they’re always prepared for whatever comes next.
Improves Safety
Lean maintenance emphasizes safe, standardized, and predictable work.
In lean operations, work orders always include detailed instructions, PPE requirements, hazard warnings, and lockout/tagout (LOTO) procedures.
This ensures technicians follow a consistent, proven approach every time, thus minimizing the risk of accidents and injuries.
Lean maintenance also leverages the 5S methodology for workplace organization, ensuring tools are properly stored, and work areas remain clean and free from obstructions.
The methodology consists of the following elements:
Sort Separate essential from non-essential items, removing unnecessary tools, parts, and clutter to free up space and minimize distractions.Set in OrderArrange necessary items logically so they are easy to find, use, and return, reducing wasted motion.ShineClean the workspace and equipment regularly, treating cleaning as a form of inspection to detect issues like leaks or wear before they lead to breakdowns.StandardizeEstablish consistent procedures and visual controls (such as labels and color-coding) for the first three steps, turning them into habits.SustainBuild the discipline to maintain these standards through audits, training, and integration into the company culture, ensuring long-term success.
While this approach may seem somewhat straightforward, it is highly effective at reducing slips, falls, and other common workplace accidents while also speeding up work.
Honda’s minivan and sport utility vehicle assembly plant in Lincoln, Alabama, is clear proof of this methodology’s effectiveness.
Their lean program prioritizes cleanliness and tidiness as key drivers of both safety and efficiency.
Paul V. Arnold, Digital Content Manager and Strategist at WorldatWork, described his 2018 tour of the facility as follows:
Illustration: WorkTrek / Quote: Reliable Plant
The overarching goal is to eliminate distractions that could pull employees’ attention away from their work.
That’s why Honda invests heavily in landscaping, common areas, and other aspects of the work environment.
Their Chief Technical Specialist at the time, Mark LaRue, explained it this way:
“You must have reliable utilities. You must have a comfortable workspace. You must have clean, functional common areas. That really sets the tone for how we want to be making a vehicle. We remove the distractions.”
There is no greater distraction than a safety incident.
However, at Honda, there is very little room for those, thanks to their commitment to cleanliness and organization.
As a result, employees feel safer and more valued, which boosts motivation and productivity while reducing turnover and recruitment costs.
After all, people are a company’s most valuable asset, and Honda understands this very well.
Helps Outpace Competition
Ultimately, lean maintenance directly supports operational excellence by giving organizations a sustained competitive advantage.
It drives lower maintenance and operating costs while improving equipment reliability and throughput, leading to higher product quality and faster responses to customer demand.
In short, it enables organizations to deliver products faster, cheaper, and more reliably than their competitors.
Just ask Boeing.
According to Scott Stocker, Vice President and General Manager of the 787 Program, lean is central to customer satisfaction:
“By reducing waste and streamlining processes, Lean helps increase efficiency and productivity. Every Lean improvement […] helps us deliver on our quality, safety, and on-time delivery commitments to our customers.”
However, lean maintenance isn’t only about meeting customer expectations.
At Boeing, it is also a powerful driver of innovation.
As Stocker explains:
Illustration: WorkTrek / Quote: Boeing
By eliminating unnecessary work, he adds, teams are energized to think creatively and develop new solutions to the complex challenges of the aerospace industry.
This is what enables them to develop better, more relevant products for their customers.
After all, product quality is a decisive competitive factor.
According to Forbes, the majority of consumers are willing to switch brands for better quality and selection.
Illustration: WorkTrek / Data: Forbes
Overall, while many companies try to outperform competitors through pricing and marketing alone, lean maintenance enables organizations to win through superior execution.
It allows them to lower costs without cutting corners and increase reliability without adding assets, delivering the reliability, predictability, and stability customers value.
That’s how you keep winning over the long term.
Conclusion
Lean maintenance is more complex than a traditional time-based maintenance program.
It requires more than a static schedule. It calls for a company-wide mindset shift that prioritizes condition monitoring, efficiency, and waste reduction.
The effort, however, is well worth it.
Lean maintenance creates the space for organizations to innovate and lead, rather than constantly struggle to keep up with competitors.
In environments where speed, quality, and reliability define success, such as manufacturing, this is invaluable.

Operations & Maintenance
8 Common Root Causes of Equipment Failure
Key Takeaways:
Inadequate lubrication accounts for 35-40% of all equipment failures, making it the leading cause of equipment breakdowns.
Manufacturing facilities implementing systematic failure analysis achieve 40-60% reductions in unplanned downtime.
Proper operator training can prevent up to 12% of equipment failures caused by improper operation and human error.
Maintenance managers don't like it when equipment fails. When consequences extend far beyond immediate repair costs.
Illustration: WorkTrek / Data: Oxmaint
Production stops, maintenance teams scramble to identify impending issues, and every minute of unplanned downtime translates into lost revenue.
According to a 2024 Siemens study, the annual cost of downtime at a large automotive plant has reached $695 million.
Understanding the common causes of equipment failure is essential for organizations aiming to reduce costly downtime and prevent expensive, unplanned outages.
Research shows that 85-90% of equipment breakdowns can be traced to just eight common root causes.
Understanding equipment failure enables maintenance teams to implement proactive management strategies that minimize downtime and improve operational efficiency.
One approach is to use root cause analysis (RCA) techniques, such as the "5 Whys" or Fishbone diagrams, which are effective tools for identifying the underlying causes of equipment failures.
1. Inadequate Lubrication
Inadequate lubrication is likely the single most common cause of equipment failure. It is responsible for 35-40% of all equipment breakdowns.
This includes insufficient lubricant quantity, wrong lubricant type, contaminated lubricants, and over-lubrication.
Illustration: WorkTrek / Data: Machinery Lurication
When equipment bearings don't receive proper lubrication, metal-to-metal contact generates extreme heat and friction. This can lead to premature wear and total equipment failure.
Research shows that lubrication-related failures typically provide a 2-8 week warning period through vibration analysis and temperature monitoring.
Reduce Lubrication Problems
How do you reduce this type of failure?
By implementing a comprehensive lubrication management programs that specify the correct lubricant for each asset, establishes regular lubrication schedules, and uses oil analysis to monitor condition.
What really can reduce this type of failure is by implementing a computerized maintenance management system that can help ensure consistent application of proper lubrication practices across all critical equipment.
2. Normal Wear and Aging Equipment
Perfect maintenance cannot avoid the inevitable normal wear and tear on equipment.
This natural deterioration accounts for 18-25% of equipment failures and is one of the most predictable causes maintenance managers face.
Aging equipment is a challenge since degradation becomes harder to predict over time.
Source: WorkTrek
The Plant Engineering Maintenance Study found that aging equipment is a leading contributor to equipment downtime, accounting for 40% of unplanned downtime in plants.
Assets that run continuously require more frequent repairs, resulting in higher maintenance costs and greater production interruptions.
Financial Impact of Aging Equipment
The financial impact extends well beyond direct repair costs.
Equipment operators often accept performance loss as normal, even when it’s clearly measurable. Additionally, procuring replacement parts becomes harder as manufacturers reduce production of older components.
Managing wear-related failures requires condition monitoring programs that track equipment performance trends, component life curves based on historical data, and proactive replacement planning.
For aging equipment approaching end-of-life, organizations must decide whether to continue maintenance or invest in replacement assets offering better reliability.
3. Improper Installation and Assembly
Improper installation accounts for anywhere from 12 to 18% of equipment failures. This makes it the third-most-common root cause.
Installation errors include misalignment between components, incorrect torque specifications, and improper fit between mating parts.
Illustration: WorkTrek / Data: Plant Services
These problems often manifest within 1-6 months of installation and not necessarily on day one.
Manufacturing maintenance experts note that installation problems frequently occur during major overhauls, component replacements, and the introduction of new assets.
Preventing installation-related failures requires detailed installation procedures specifying exact requirements for alignment, torque, and fit tolerances.
Quality control inspections immediately following installation help catch errors before equipment enters service. For complex installations, precision measurement tools and laser alignment systems ensure accuracy beyond manual methods, delivering significant returns by preventing costly breakdowns.
4. Contamination of Equipment Components
Contamination represents a particularly insidious cause of equipment failures. Industry data shows that it can be responsible for 8-15% of equipment breakdowns.
Foreign material, including dirt, water, chemicals, and process materials, can enter systems through multiple pathways and cause widespread damage before detection occurs.
Illustration: WorkTrek / Data: IDCON
The impact varies significantly by equipment type and operating environment.
In hydraulic systems, even microscopic particles can damage precision components. This can lead to leaks, reduced efficiency, and eventual system failure. In bearing assemblies, contaminated lubricants act like grinding paste, accelerating wear rates and dramatically shortening component life. In electrical equipment, moisture can cause short circuits, corrosion, and insulation breakdown, leading to dangerous failures.
How long does contamination take to show up?
Contamination-related problems can emerge within 1-4 weeks once foreign material enters a system.
This compressed timeline demands consistent monitoring from maintenance teams to prevent minor contamination from escalating into major equipment breakdowns.
Unlike wear-based failures that develop gradually over months, contamination creates urgent situations requiring quick response.
Various Manufacturing Environments
Manufacturing environments present countless opportunities for contamination through process material leaks, environmental dust entering through worn seals, condensation forming in enclosed spaces, and cleaning chemicals inadvertently contacting sensitive components.
Each contamination pathway requires specific prevention strategies that are tailored to the equipment and operating conditions.
Contamination control requires proper sealing systems, breather filters on reservoirs, and protective covers for exposed components.
Regular oil analysis helps detect contamination early, while visual inspections identify potential entry points before problems develop.
For critical equipment in harsh environments, implementing proper maintenance schedules with frequent contamination checks becomes essential for preventing costly downtime.
5. Operator Error and Improper Operation
Operator error accounts for 6-12% of equipment breakdowns. The State of Industrial Maintenance 2024 report shows 12% of respondents anticipated operator error as a leading cause of unplanned downtime.
Operator-related issues range from incorrect startups to improper loading and failure to follow standard operating procedures. These mistakes usually stem from systemic issues, including a lack of standardized work procedures, inadequate operator training, and poor human-machine interface design.
Illustration: WorkTrek / Data: ICW group
Operator failures often mimic mechanical faults during troubleshooting, potentially masking the real issue of a lack of operational discipline. Running equipment beyond rated capacity, ignoring warning signs, or failing to perform basic operator care tasks can all lead to premature failure.
Prevention requires adequate operator training that covers proper operation, basic troubleshooting, and the recognition of abnormal conditions.
Safety Procedures
Safety procedures should be an integral part of operator training and proper equipment handling to minimize errors and ensure safe operation.
Standard operating procedures should be readily accessible and regularly updated.
Cross-training workers across multiple machines builds redundancy and deepens equipment understanding, supporting a culture of equipment reliability and proactive maintenance.
Management must strictly enforce policies that prevent untrained employees from operating machinery.
6. Improper Usage and Overloading
Improper usage occurs when equipment is misapplied or subjected to conditions outside design specifications.
Illustration: WorkTrek / Data: ETProtein
This includes operating beyond rated capacity, using assets for unintended applications, and running machinery in unsuitable environmental conditions. Heavy equipment, such as cranes and excavators, is particularly susceptible to overload damage and requires specialized maintenance to prevent failures.
The consequences are severe.
Overloaded motors overheat and burn out. Conveyors beyond design specifications experience excessive vibration and premature bearing failure.
Hydraulic systems pushed past pressure ratings develop catastrophic failures. Each instance accumulates stress that accelerates machine failure.
Manufacturing operations sometimes maximize output by pushing equipment beyond limits. This short-term thinking ignores the long-term costs of higher repair costs, reduced equipment lifespan, and safety implications.
Prevention Steps
Prevention requires clear communication about equipment limitations and management support for proper operation. Equipment operators need to understand the designed capabilities and limitations. Standard operating procedures should explicitly state capacity limits and warning signs of overstressed equipment.
For critical assets, implementing automatic controls, such as load monitoring and pressure relief valves, provides mechanical safeguards against improper use.
7. Design Deficiencies
Design deficiencies can account for 4-8% of failures. These inherent equipment problems include inadequate material selection, insufficient cooling capacity, structural weaknesses, and components that wear faster than anticipated.
Illustration: WorkTrek / Data: ScienceDirect
Design-related failures typically surface 6-24 months after installation, distinguishing them from installation errors that appear quickly.
Manufacturing facilities identify these deficiencies through pattern recognition—when the same component repeatedly fails on identical machines despite proper maintenance.
Address Design Deficiency Issues
Addressing design deficiencies requires engineering modifications, such as upgrading materials, adding cooling capacity, reinforcing weak elements, or redesigning components.
While these represent significant investments, they're often the only permanent solution to chronic failure modes. For assets with known design deficiencies, organizations must choose between implementing modifications, accepting higher maintenance costs, or planning early replacement.
8. Lack of Proper Maintenance
Like most mechanical equipment, a lack of proper maintenance often becomes both a root cause and amplifier of other failure modes.
When maintenance tasks are skipped or performed inadequately, equipment can fail prematurely.
This can drive up maintenance costs and create costly downtime. Ongoing maintenance and structured equipment maintenance programs are essential to prevent these issues and ensure long-term asset reliability.
Causes of Inadequate Maintenance
Many organizations struggle with proper maintenance due to budget constraints, staffing limitations, poor planning systems, or competing priorities.
Facilities that defer routine maintenance tasks often face dramatically higher repair costs when equipment eventually fails. Emergency repairs typically cost 3-5 times as much as planned maintenance.
Efficient planning methods, such as tracking equipment with asset tags and inventory control, support optimal performance and help minimize downtime. Including other maintenance tasks beyond basic repairs, such as inspections and documentation, ensures comprehensive maintenance coverage.
Results of Excessive Maintenance
Excessive maintenance also deserves attention.
Over-maintenance, or too much maintenance, can accelerate wear, waste parts, and divert attention from critical areas.
Over-maintenance can accelerate an asset's depreciation by constantly disassembling and reconfiguring equipment components, increasing operational costs and disrupting system stability.
The key is to create a balance, with schedules based on equipment condition, manufacturer recommendations, and historical data rather than arbitrary intervals. Maintenance technicians play a key role in monitoring and balancing maintenance activities to avoid both under- and over-maintenance.
Modern preventive maintenance programs increasingly rely on data and condition monitoring to optimize timing. Condition-based maintenance (CBM) optimizes maintenance efforts by performing tasks only when necessary, reducing inefficiencies and preventing unnecessary interventions.
9. Environmental Factors
Environmental factors are often overlooked contributors to equipment failure. But they do have a profound impact on asset health and the longevity of critical assets.
Poor storage conditions, exposure to pests, high humidity, and extreme temperatures can all accelerate wear and lead to premature breakdowns. Inadequate facilities or improper environmental controls can compromise even the most robust equipment, increasing the risk of unplanned downtime and costly repairs.
Illustration: WorkTrek / Data: MDPI
To prevent equipment failure caused by environmental stress, organizations should incorporate regular environmental audits into their proactive maintenance strategy.
These audits help maintenance teams identify and address vulnerabilities in storage, handling, and operating environments. Ongoing monitoring of temperature, humidity, and other environmental conditions ensures that critical assets remain protected and perform reliably.
By integrating environmental management into proactive maintenance, companies can safeguard their equipment, extend asset life, and reduce the risk of unexpected failures.
How CMMS Software Helps Prevent Equipment Failure
A computerized maintenance management system like WorKTrek serves as the foundation for preventing equipment failure through systematic maintenance management. Modern CMMS solutions like WorkTrek directly combat each of the eight common root causes through specific capabilities.
For lubrication management, CMMS schedules can track lubrication tasks, store lubricant specifications for each asset, and generate oil analysis work orders. This ensures inadequate lubrication, the leading cause of equipment failure, receives consistent attention.
For aging equipment, CMMS provides comprehensive asset tracking that monitors equipment age, usage hours, and performance trends. Historical data reveals patterns indicating when preventive maintenance should transition to planned replacement.
Installation quality improves through CMMS-managed procedures and checklists.
Source: WorkTrek
CMMS allows teams to attach detailed installation instructions, torque specifications, and alignment procedures to work orders. Quality control steps can be built into workflows to ensure technicians follow proper procedures.
The system's inventory management ensures spare parts and materials are available, reducing the temptation to skip or delay maintenance. Real-time inventory tracking prevents both stockouts of critical components and excessive carrying costs.
Source: WorkTrek
With reporting and analytics provide insights into maintenance performance, failure trends, and cost analysis that help teams continuously improve. For structured evaluation, consult this maintenance audit checklist to optimize your auditing process.
By identifying which assets consume the most resources and which failure modes occur most frequently, organizations can optimize their maintenance strategies for maximum impact.
Conclusion
The eight causes we’ve explored, from inadequate lubrication to lack of proper maintenance, account for 85-90% of equipment breakdowns that plague manufacturing operations and drive costly downtime.
The key insight is that equipment failures rarely happen randomly. They follow predictable patterns, provide warning signs, and respond to systematic prevention strategies.
Whether it’s implementing comprehensive lubrication programs to address the 35-40% of failures caused by inadequate lubrication, or establishing robust operator training to prevent the 6-12% of failures stemming from improper operation, targeted interventions deliver measurable results. Inadequate operator training can directly lead to machinery failure and increased downtime, making it essential to invest in proper training and clear SOPs to reduce the risk of equipment breakdowns.
Modern maintenance professionals have powerful tools at their disposal.
Computerized maintenance management systems provide the organizational infrastructure to prevent equipment failure through scheduled maintenance tasks, comprehensive documentation, and data-driven insights.
Source: WorkTrek
Condition-monitoring technologies such as vibration and oil analysis detect impending issues before equipment fails. Together, these tools enable the proactive maintenance strategy that keeps critical equipment running and costs under control.
Start by evaluating your current maintenance practices against the eight root causes outlined in this article.
Identify which factors contribute most significantly to your equipment failures. Are lubrication problems causing premature bearing failures? Is aging equipment approaching end-of-life without replacement planning? Are operators receiving adequate training to prevent improper operation?
Develop targeted prevention strategies that address your most significant failure modes.
For many organizations, this starts with implementing a CMMS to establish the foundation for systematic maintenance management. From there, layer on condition monitoring, operator training programs, and precision maintenance practices as resources and capabilities grow.
Leverage technology platforms like WorkTrek to ensure consistent execution of your maintenance programs. The investment in proper tools pays dividends through improved equipment reliability, reduced maintenance costs, and greater operational efficiency across your manufacturing operations.
Remember that preventing equipment failure is an ongoing journey, not a destination.
Equipment and operating conditions change, new failure modes emerge, and maintenance strategies must evolve accordingly. Organizations that embrace continuous improvement in their maintenance processes consistently outperform those that remain stuck in reactive maintenance patterns.

Operations & Maintenance
6 Ways to Leverage Maintenance History Records
Key Takeaways:
Accurate troubleshooting was the biggest challenge for fleets in 2025.
Noncompliance in maintenance leads to fines, reputational damage, and operational shutdowns.
40% of organizations have reduced their facilities management budgets in 2025.
Your historical maintenance data has the potential to transform your operations beyond recognition.
It can help reduce costs, boost technician productivity, and improve overall equipment reliability.
You just need to know what to look for and how to act on it.
This article shows you exactly that, outlining six ways to leverage maintenance history records to unlock new levels of efficiency.
Identifying Recurring Equipment Issues
Maintenance history records make it easier to spot patterns that might otherwise go unnoticed, helping you address recurring asset issues.
This makes them especially valuable today, when modern companies struggle with accurate troubleshooting and diagnostics, along with hiring technicians with the right skill sets.
Illustration: WorkTrek / Data: Noregon
Maintenance records help solve both of these problems at once.
By capturing detailed maintenance data, you can move beyond temporary fixes and focus on permanent solutions, thereby reducing repeat failures, downtime, and costly, unnecessary labor.
Put simply, maintenance history records make your work more effective, allowing you to do more with less.
For example, reviewing past work orders (as shown below) can reveal whether the same component or system fails repeatedly.
Source: WorkTrek
This is often a sign of a systemic issue rather than random failure, indicating that previous repairs may have addressed symptoms instead of root causes.
With the right record-keeping system, you can analyze data even more deeply, including run hours, responsible personnel, and operating conditions for each individual machine.
This enables patterns such as failures occurring after a specific number of operating hours or seasonal breakdowns.
You could also compare multiple assets to get amore complete picture, identifying which machines consume the most labor or parts and which components fail disproportionately often.
This supports more strategic decisions around upgrades, replacements, and long-term maintenance planning.
In the end, without maintenance records, all these issues remain largely invisible, becoming silent killers of reliability, efficiency, and profitability.
That’s what makes recurring problems so dangerous: they don’t announce themselves until the damage is already done.
It’s no surprise, then, that most manufacturing companies are now investing heavily in better data collection and analysis.
Illustration: WorkTrek / Data: Limble
Visibility is the first step toward control, and reliable data is the key to maintaining stable, efficient, and resilient operations.
Improving Preventive Maintenance Scheduling
You can also use your maintenance history to fine-tune your preventive maintenance (PM) program.
Instead of relying on often generic, manufacturer-recommended PM intervals, historical data shows how long components last in your operating environment and when failures typically occur.
This allows you to optimize maintenance schedules so assets receive the care they need, exactly when they need it.
The result: fewer major failures and less unplanned downtime.
A great example comes from the Lake Mainit hydropower plant in the Philippines.
By analyzing historical maintenance data, the plant’s maintenance service provider identified a variation in the actuation time of the main inlet valve on Unit 1.
This early warning enabled them to intervene in time, replace the valve, and prevent a full plant shutdown.
Angelo A. Panganiban, Plant Manager at the Lake Mainit hydropower plant, commented:
Illustration: WorkTrek / Quote: Water Power Magazine
This example clearly shows why historical maintenance data matters.
It reflects how equipment actually behaves under real operating conditions, not how it was expected to behave on paper, allowing you to tailor your PM program to real-world needs.
This is even more true when maintenance data is managed in a digital maintenance management system, such as a CMMS.
These tools automatically track and analyze data, schedule maintenance tasks, and notify technicians at the right time for more accurate and reliable PM execution.
Take our CMMS, WorkTrek, as an example.
It lets you create recurring tasks based on criteria that best suit your assets, whether fixed time intervals or condition-based triggers like operating hours, temperature, mileage, pressure, and more.
Source: WorkTrek
You can also define priority levels, assign responsible technicians, set due dates, attach SOPs, plan task duration, and establish end rules for each recurring job.
When a task is due, technicians receive automated reminders, while supervisors can monitor progress and compliance through an intuitive dashboard, like the one you see below:
Source: WorkTrek
The result is a precise, data-driven preventive maintenance program that teams actually follow.
No more guesswork, no more forgotten tasks, and no more operational disruption.
Strengthening Compliance
Your maintenance history records are your first line of defense against noncompliance with safety, health, and regulatory requirements, as well as the consequences that follow.
These can range from costly fines that only seem to increase year after year to irreparable reputational damage and even operational shutdowns.
You can learn more about these risks in the video below.
https://www.youtube.com/watch?v=Qj-RgCd9nhw&source_ve_path=MTc4NDI0
Source: SFG20 on YouTube
Highly regulated industries, such as aviation, should prioritize proper record-keeping the most.
Max Lutje Wooldrik, Founder & CEO of AeroVerify, an aviation document security platform, warns airlines against relying on outdated, paper-based systems.
According to him, such systems can’t keep pace with growing industry complexity and regulatory scrutiny, nor do they deliver the accuracy and security modern aviation operations need.
However, with well-organized, digitized historical data, companies stand a fighting chance, Wooldrik explains:
Illustration: WorkTrek / Quote: AviTrader
This is because historical records provide documented, traceable evidence that required maintenance activities were carried out correctly.
They clearly show what maintenance was performed, when it was completed, who performed it, and which standards were followed, with any deviations properly documented and approved.
In addition, these records can demonstrate that appropriate PPE was used and that safety rules and lockout/tagout procedures were followed:
Source: WorkTrek
When all of this information is stored in a single, easily searchable system, audits become straightforward and are no longer a major source of stress or chaos.
Better Budget Planning
With historical maintenance data, you don’t have to rely on estimates or assumptions to forecast future costs and plan budgets.
Given the current state of the maintenance industry, there’s very little room left for subjective judgment anyway.
The 2025 BCIS Facilities Management Forecast predicts that maintenance costs, as measured by the BCIS All-in Maintenance Cost Indices, will rise by 17% by Q4 2029.
Illustration: WorkTrek / Data: BCIS
MRO parts are becoming more expensive, new technologies are entering the market, equipment is increasingly complex to maintain, and skilled workers are hard (and costly) to find.
Maintenance budgets need to account for all of this while still being sufficient to keep operations running smoothly and reliably.
That would seem to suggest that budgets, along with costs, must be increasing, right?
Wrong.
According to a 2025 report by SFG20, 40% of organizations have reduced their facilities management budgets compared to the previous year.
Illustration: WorkTrek / Data: SFG20
As a result, maintenance teams find themselves in a difficult position.
They’re expected to maintain the same level of efficiency, or even improve it, with fewer resources.
This is where maintenance history records become vital.
They provide clear visibility into past spending on labor, parts, contractor services, emergency repairs, and other cost categories:
Source: WorkTrek
By analyzing this data, you can more accurately predict annual maintenance costs by asset or system, create more realistic budgets, and improve long-term financial planning.
Similarly, these records allow you to compare planned versus unplanned costs, revealing how much is spent on preventive versus reactive maintenance.
This makes it easier to demonstrate to leadership that reactive work is more expensive and disruptive, helping justify investment in more effective maintenance strategies.
All in all, maintenance records are critical for forecasting future expenses more accurately and allocating resources where they deliver the most value.
In fact, with compelling data to support the case, they may even help secure bigger budgets.
Easier Parts Inventory Forecasting
Maintenance history records help with more accurate and efficient parts inventory forecasting by revealing which parts are actually used, how often, and under what conditions.
This information is more important than many realize, as accurate spare parts forecasting can make or break operations.
Jim Owens, President at Marrad, a technology-enabled supply chain solutions company that focuses on sustainable materials management, agrees:
Illustration: WorkTrek / Quote: Modern Materials Handling
Overestimating your needs ties up money and space in inventory that may never be used and could become obsolete.
Underestimating, on the other hand, risks last-minute emergency purchases and costly production stoppages.
Neither scenario benefits your operations.
However, by analyzing historical maintenance data, you can identify which spare parts are used most often, which fail repeatedly, and which components are common across multiple assets:
Source: WorkTrek
This allows you to classify parts based on criticality and consumption rate, ensuring stock levels reflect actual needs rather than assumptions.
You can order more high-risk items that often cause downtime, thereby reducing production interruptions and the cost of rush orders.
Similarly, you can identify rarely used parts to reallocate or dispose of, freeing up storage space and capital.
As a result, you benefit from a balanced inventory strategy that keeps critical parts available while minimizing unnecessary costs.
Ensuring Accountability
Maintenance history records are a great tool for accountability because they create a clear, traceable record of who did what, when, and how.
This allows you to track responsibility, verify work quality, and improve overall reliability.
When something goes wrong, instead of endless finger-pointing and guesswork, you can quickly pinpoint where the process broke down.
For example, if a tool goes missing, the records show who last used it and where.
If a task wasn’t completed, the records indicate who was assigned and when it was due:
Source: WorkTrek
Every action is attributable to a specific individual.
This not only helps supervisors monitor schedule compliance but also promotes personal responsibility among workers and reduces the likelihood of errors or skipped tasks.
Keith Fagan, Director Global Learning and Talent Development at Ritchie Bros, a marketplace for used equipment, trucks, and industrial assets, explains:
Illustration: WorkTrek / Quote: Transport Topics
After all, maintenance records expose weak links, inefficiencies, or mistakes, and no one wants to be the person slowing things down.
At the same time, they spotlight top performers, giving your team clear examples of excellence to aim for.
In the end, such transparency and clear roles create an environment where employees not only take responsibility but actually want to do better, sometimes even competing with each other in a healthy way.
That’s how you end up with highly motivated, productive, and engaged team members.
Conclusion
Hopefully, this article has opened your eyes to the power of historical maintenance data.
When used effectively, it can unlock a wide range of benefits, boosting both productivity and profitability.
However, all of this depends on having accurate, up-to-date, and complete data.
So, before jumping into any kind of analysis, take the time to thoroughly audit your records and ensure you have a strong foundation for making meaningful operational improvements.
Operations & Maintenance
7 Equipment Failure Metrics You Should Be Tracking
Key Takeaways:
Unplanned downtime costs the world's 500 biggest companies $1.4 trillion annually.
65% of companies use CMMS software to track and optimize maintenance performance metrics.
Equipment failures account for 42% of all unplanned downtime incidents.
Every piece of equipment in your facility tells a story through data. If you are not tracking, it is likely that you are missing some critical information and valuable opportunities to reduce downtime.
Illustration: WorkTrek / Data: Gitnux
Equipment failure metrics provide measurable insights into how well your maintenance team performs, where vulnerabilities exist in your systems, and what actions you need to take to prevent costly breakdowns before they happen.
In this guide, we'll explore seven essential equipment failure metrics you should be tracking, why they matter, and how modern CMMS technology makes monitoring these key performance indicators easier than ever.
Why Equipment Failure Metrics Matter
The financial impact of equipment failures has reached staggering proportions.
According to Siemens' 2024 True Cost of Downtime report, unplanned downtime saps 11% of annual revenues from the world's 500 biggest companies. That is a staggering total of $1.4 trillion, which is a large increase from $864 billion in 2019.
For individual facilities, the numbers are equally alarming.
Illustration: WorkTrek / Source: ZipDo
In the automotive industry, a single hour of downtime at a large plant costs up to $2.3 million, or roughly $600 per second.
But here's what makes tracking failure metrics so powerful: equipment failures account for approximately 42% of unplanned downtime incidents, meaning nearly half of your production losses are preventable with the right maintenance strategy.
Multiple failure metrics give you the data you need to shift from reactive maintenance to proactive maintenance approaches that minimize downtime and reduce costs.
The challenge is knowing which metrics to track.
The 7 Critical Equipment Failure Metrics
Let's examine the seven equipment failure metrics that provide the most actionable insights for your maintenance operations.
1. Mean Time to Repair (MTTR)
Mean time to repair measures the average time your maintenance team takes to repair failed equipment and restore it to full operational status.
Illustration: WorkTrek / Data: INTECH Automation & Intelligence
This metric tracking starts when a failure occurs and ends when the equipment is back in service.
Here's the formula:
MTTR = Total Repair Time ÷ Number of Repairs
For example, if your maintenance team spent 100 hours fixing a specific asset over the past year, and that asset failed 10 times during that time period, your MTTR would be 10 hours.
Why MTTR Matters
MTTR is one of the most common failure metrics because it directly measures your maintenance team's efficiency in responding to system failures.
A lower MTTR means your team can diagnose problems quickly, has the right parts on hand, and can execute repair processes effectively.
Illustration: WorkTrek
According to MaintainX's 2024 State of Industrial Maintenance report, the average time to complete unplanned maintenance work varies significantly across industries, but reducing MTTR consistently delivers measurable cost savings.
MTTR includes several components. To better understand the importance of predictive maintenance and its impact on maintenance strategies, check out these key statistics about predictive maintenance.
Time to detect the failure
Time to notify the maintenance team
Time to diagnose the root causes
Time to obtain the necessary parts
Actual repair time
Time to test and restart the equipment
By breaking down these components, you can identify bottlenecks in your repair processes and make targeted improvements.
2. Mean Time Between Failures (MTBF)
The mean time between failures (MTBF) is the average operational time between failures for repairable systems.
This is a critical maintenance performance metric that measures asset reliability rather than repair speed.
Source: WorkTrek
The calculation is straightforward:
MTBF = Total Operational Hours ÷ Number of Failures
If an asset ran for 20,000 hours over the past year and experienced four system failures, your MTBF would be 5,000 hours.
Why MTBF Matters
MTBF tells you how reliable equipment is under normal operating conditions.
A higher MTBF indicates more reliable equipment that experiences fewer production interruptions. This metric helps maintenance managers forecast when failures are likely to occur and schedule preventive maintenance accordingly.
When calculating MTBF, you include time spent on preventive maintenance but exclude time spent on repairs. This gives you a true picture of how long equipment runs between failure events.
According to ABB's 2023 Maintenance and Reliability Survey, more than two-thirds of companies experience unplanned downtime events weekly or even daily, highlighting why tracking MTBF is essential for improving asset reliability.
3. Mean Time to Failure (MTTF)
Mean time to failure measures the expected lifespan of non-repairable assets—items that must be replaced rather than repaired when they fail.
Source: WorkTrek
Unlike MTBF, which applies to repairable systems, MTTF is calculated for components like:
Bearings
Motors
Conveyor belts
Light bulbs
Filters
The formula is:
MTTF = Total Operational Hours ÷ Number of Assets
Suppose you installed 40 motors last year, and by year's end, all had failed after a combined 20,000 hours of operation. Your MTTF would be 500 hours.
Why MTTF Matters
MTTF helps you plan replacement schedules and manage spare parts inventory more effectively.
When you know the average time a specific asset operates before product or system failure, you can proactively order replacements and schedule installation during planned downtime rather than scrambling during an emergency.
This metric is particularly valuable for inventory management, allowing you to stock the right parts in the right quantities without tying up excessive capital in spare parts.
4. Overall Equipment Effectiveness (OEE)
Overall equipment effectiveness is a comprehensive metric that measures how well your equipment performs compared to its theoretical maximum output.
Source: WorkTrek
OEE combines three factors:
Availability – The percentage of scheduled time that equipment is available for production
Performance – How fast the equipment runs compared to its designed speed
Quality – The percentage of products that meet quality standards
The formula is:
OEE = Availability × Performance × Quality
An OEE score of 100% means you're manufacturing only good parts, as fast as possible, with no unplanned downtime.
In reality, world-class manufacturers typically achieve OEE scores of 85% or higher. Metrics such as Mean Time Between Failure (MTBF) also play a crucial role in assessing equipment reliability.
Why OEE Matters
OEE provides a holistic view of equipment effectiveness by accounting for multiple failure modes:
Availability losses from system failures, changeovers, and unplanned maintenance
Performance losses from slow cycles, minor stops, and reduced speed
Quality losses from defects and rework
By tracking OEE alongside other maintenance metrics, you can identify which factor most limits your productivity and focus improvement efforts accordingly.
According to industry research, manufacturers experience an average of 25 downtime incidents per month, and large plants lose 27 hours per month to unplanned downtime. All of these are factors that directly impact OEE scores.
5. Planned Maintenance Percentage (PMP)
Planned maintenance percentage measures what portion of your total maintenance work is scheduled in advance versus reactive.
This is one of the most revealing indicators of a maintenance program's health.
The calculation:
PMP = (Planned Maintenance Hours ÷ Total Maintenance Hours) × 100
If your team spent 800 hours on planned maintenance and 200 hours on emergency repairs last month, your PMP would be 80%.
Why PMP Matters
A higher planned maintenance percentage indicates a more proactive maintenance strategy.
Teams with high PMP scores experience fewer emergencies, better resource utilization, and more predictable maintenance costs.
According to UpKeep's 2024 State of Maintenance Report, 65% of respondents identified proactive maintenance as the most effective way to reduce unplanned downtime incidents.
However, the same research found that while 86.8% of facilities use preventive maintenance strategies, almost 60% dedicate less than half of their total maintenance time to them.
This highlights a critical gap between intention and execution.
Industry best practice targets a PMP of 85% or higher, meaning at least 85% of your maintenance activities should be planned rather than reactive.
6. Maintenance Backlog
Maintenance backlog measures the amount of approved maintenance work waiting to be completed.
This metric helps maintenance managers understand resource allocation and whether the maintenance team can keep pace with demand.
The calculation typically uses labor hours:
Maintenance Backlog = Total Hours of Approved Work Orders Not Yet Completed
A healthy backlog is typically 2-4 weeks of work. Too little backlog suggests your team may not have enough work planned ahead. Too much indicates your team is overwhelmed and falling behind.
Why Maintenance Backlog Matters
Tracking your maintenance backlog helps you:
Identify staffing needs
Prioritize critical maintenance work
Prevent the accumulation of deferred maintenance
Balance preventive maintenance with corrective work
An increasing backlog often signals that your team needs additional resources, better planning, or more efficient troubleshooting techniques.
According to WorkTrek's maintenance cost statistics, managing backlog effectively is essential for controlling maintenance costs, as work that gets continuously deferred often becomes more expensive to address later.
7. Schedule Compliance
Schedule compliance measures how effectively your maintenance team completes planned work on time.
This metric reveals whether your preventive maintenance schedule is realistic and achievable.
Illustration: WorkTrek / Data: INTECH Automation & Intelligence
The formula:
Schedule Compliance = (Work Orders Completed On Time ÷ Total Scheduled Work Orders) × 100
If you scheduled 100 preventive maintenance tasks last month and completed 85 of them on or before their due dates, your schedule compliance would be 85%.
Why Schedule Compliance Matters
Low schedule compliance often indicates one or more problems:
Unrealistic maintenance schedules
Insufficient staffing
Poor parts availability
Excessive emergency work interrupts planned tasks
Inadequate maintenance planning
High schedule compliance (typically 90% or above) indicates your team has effective processes, adequate resources, and realistic schedules.
This metric is particularly valuable when paired with PMP. If both metrics are high, your maintenance operations are well planned and well executed. If PMP is high but schedule compliance is low, you may have planning problems or resource constraints.
How CMMS Software Helps Track Failure Metrics
Manually calculating and tracking multiple failure metrics across dozens or hundreds of assets is nearly impossible without dedicated software.
That's where a CMMS (Computerized Maintenance Management System) becomes essential.
According to UpKeep's research, 65% of companies now use CMMS software to manage maintenance activities and track key performance indicators.
How WorkTrek Automates Metric Tracking
WorkTrek makes tracking failure metrics effortless by automatically collecting data throughout your entire maintenance process.
Source: WorkTrek
Here's how it works:
Automatic Time Tracking
Every time a technician receives a work order, starts a repair, and completes the task, WorkTrek automatically logs the timestamps. This real-time data feeds directly into MTTR calculations without any manual entry.
Source: WorkTrek
Asset Performance Monitoring
WorkTrek tracks every failure event for each asset in your system. The software maintains a complete maintenance history and automatically calculates MTBF and MTTF based on operational hours and failure frequency.
Source: WorkTrek
Work Order Classification
Source: WorkTrek
WorkTrek categorizes work orders as planned or unplanned, enabling the system to automatically calculate your planned maintenance percentage. You can see at a glance whether you're spending too much time fighting fires instead of preventing them.
Built-In Analytics and Reporting
Source: WorkTrek
Rather than exporting data to spreadsheets and manually creating charts, WorkTrek provides over 50 pre-built reports and more than 20 pre-built KPIs.
These dashboards display your failure metrics in real-time, making it easy to spot trends and identify areas for improvement.
Preventive Maintenance Scheduling
Source: WorkTrek
WorkTrek's preventive maintenance features help you create schedules based on time, meter readings, or actual asset conditions. The system automatically generates work orders and tracks schedule compliance, showing you exactly which preventive tasks are completed on time.
Mobile Access for Faster Response
Source: WorkTrek
With WorkTrek's mobile app, technicians can access work orders, update status, and log completion data from anywhere in your facility. This reduces repair time and improves the accuracy of your MTTR calculations.
Parts and Inventory Integration
For optimal operational efficiency, it's important to understand the relationship between inventory management and maintenance strategies. You can learn more about the differences between unplanned and planned maintenance and how they impact parts usage, downtime, and long-term asset health.
WorkTrek integrates parts and inventory management directly into the maintenance workflow.
Source: WorkTrek
When parts are assigned to work orders and used during repairs, the system automatically updates inventory levels and can trigger reorder notifications.
This integration helps reduce the time technicians spend hunting for parts, which is a major contributor to extended MTTR.
Data-Driven Decisions
The real power of worktrek.comes from turning raw data into actionable insights.
For example, by analyzing planned versus actual maintenance costs across assets, you can identify equipment that consistently exceeds budget.
Source: WorkTrek
This is often a sign that replacement is more cost-effective than continued repairs.
This kind of analysis would take hours with spreadsheets. With WorkTrek, the data updates continuously, and the insights are available whenever you need them.
Best Practices for Improving Your Failure Metrics
Tracking metrics is only the first step. Here's how to use your data to drive continuous improvement in your maintenance operations.
Shift to Proactive Maintenance
The single most effective way to improve nearly all failure metrics is to adopt a proactive maintenance approach.
Source: WorkTrek
Deloitte research shows that predictive maintenance can:
Increase equipment uptime by 10-20%
Reduce maintenance costs by 5-10%
Reduce maintenance planning time by up to 50%
Proactive maintenance strategies include:
Preventive maintenance – Time-based or usage-based maintenance performed before failures occur
Predictive maintenance – Using sensors and data analysis to predict failures before they happen
Condition-based maintenance – Performing maintenance only when sensor data indicates it's needed
Each approach reduces equipment failures, improves MTBF, and decreases the time your team spends on reactive maintenance.
Standardize Repair Processes
Creating standard operating procedures (SOPs) for common repairs dramatically improves MTTR.
When technicians follow proven repair processes rather than troubleshooting from scratch each time, they complete work faster and more reliably.
Source: WorkTrek
WorkTrek allows you to attach checklists and procedures directly to work orders, ensuring technicians have step-by-step guidance for every task.
Implement Root Cause Analysis
Don't just fix failures—understand why they happen.
When the same asset fails repeatedly, conduct root cause analysis to identify the underlying problem. Common root causes include:
Inadequate preventive maintenance
Operator error
Poor equipment design
Environmental factors
Substandard replacement parts
By addressing root causes, you reduce failure frequency, improve MTBF, and prevent recurring issues that consume maintenance resources.
Optimize Spare Parts Inventory
Parts availability directly impacts MTTR. If technicians must wait hours or days for critical components, repair time extends significantly.
However, stocking too many spare parts ties up capital unnecessarily.
Source: WorkTrek
Use failure data to optimize inventory. Items with short MTTF should be stocked in higher quantities. Critical assets should have key spare parts readily available to minimize downtime. Consider utilizing a CMMS software platform to streamline maintenance and asset management processes.
WorkTrek's inventory management features track parts usage patterns and can alert you when stock levels fall below defined thresholds.
Invest in Training
Maintenance activities performed by well-trained technicians are completed faster and more effectively.
Illustration: WorkTrek / Data: Facility Executive
Regular training on:
New equipment and technologies
Troubleshooting techniques
CMMS software usage
Safety procedures
improves your team's performance across all maintenance metrics.
Use Data to Drive Resource Allocation
Review your failure metrics regularly to identify patterns:
Which assets have the lowest MTBF?
Which equipment generates the most maintenance backlog?
Where is MTTR highest?
Use this data to allocate resources strategically. Assets with poor reliability may need more frequent preventive maintenance, upgraded components, or replacement. High-MTTR assets may benefit from technician training or better parts availability.
Monitor Leading Indicators
While metrics like MTTR and MTBF are lagging indicators (they measure what already happened), leading indicators help you predict future performance.
Metrics like planned maintenance percentage and schedule compliance are leading indicators. Improving these metrics typically increases MTBF and reduces downtime.
Conclusion
Equipment failure metrics can transform maintenance from guesswork into a data-driven practice.
By tracking MTTR, MTBF, MTTF, OEE, planned maintenance percentage, maintenance backlog, and schedule compliance, you gain complete visibility into asset performance and maintenance effectiveness.
The data reveals exactly where to focus your improvement efforts, whether that's reducing repair time, improving asset reliability, or shifting more resources to preventive maintenance.
Modern CMMS platforms like WorkTrek make data collection and metric tracking easier than ever. Instead of spending hours manually gathering information from spreadsheets and paper logs, automated systems deliver real-time insights that help you make better decisions faster.
The right metrics, combined with the right tools, give you the power to minimize downtime, reduce costs, and maximize the performance of every asset in your operation.
Make your work easier.
Try for free.
Book a demo