What are Key Performance Indicators (KPIs)?
Key Performance Indicators (KPIs) in maintenance are measurable metrics used to evaluate the effectiveness and efficiency of maintenance activities. KPIs provide insights into how well maintenance teams perform and help organizations track progress toward achieving their operational goals, such as minimizing downtime, reducing maintenance costs, and improving asset reliability.
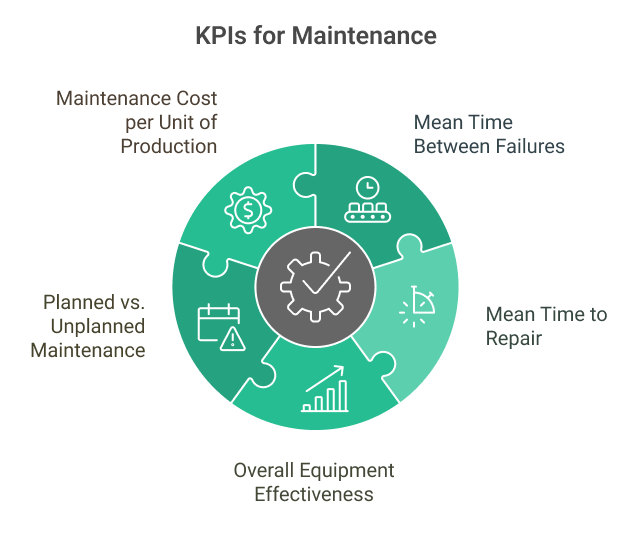
Common maintenance KPIs include:
- Mean Time Between Failures (MTBF): Measures the average time equipment operates before a failure occurs, indicating asset reliability.
- Mean Time to Repair (MTTR): The average time it takes to repair equipment after a failure, reflecting maintenance response efficiency.
- Overall Equipment Effectiveness (OEE): A metric that evaluates equipment performance by measuring its availability, performance, and quality output.
- Planned vs. Unplanned Maintenance: This chart tracks the ratio of scheduled maintenance tasks to emergency or reactive repairs, showing the effectiveness of preventive maintenance strategies.
- Maintenance Cost per Unit of Production: Analyzes maintenance expenses relative to production output to assess cost-efficiency.

Organizations can regularly monitor KPIs, identify trends, detect performance issues, and make data-driven decisions to improve maintenance practices. KPIs are often tracked using CMMS or ERP software, which provides real-time reporting and helps maintenance managers adjust strategies to optimize asset performance and extend equipment life.
Why are KPIs important to Maintenance Organizations?
Data-Driven Decision Making
First, KPIs provide data-driven decision-making capabilities. Maintenance teams can identify patterns in equipment performance and maintenance needs by tracking metrics like Mean Time Between Failures (MTBF) and Mean Time To Repair (MTTR).
For example, maintenance managers can proactively schedule interventions before a major breakdown occurs if a machine shows decreasing MTBF over several months.
Optimize Resources
KPIs also enable resource optimization. Organizations can better allocate their workforce and maintain optimal spare parts levels by tracking metrics such as maintenance technician utilization rates and parts inventory turnover.
Think of it like having a dashboard that shows exactly where your resources are being used effectively and where there might be inefficiencies to address.
Benchmarking
Performance benchmarking becomes possible through KPI tracking. When you measure metrics like planned vs. unplanned maintenance ratio or maintenance backlog, you can compare your organization’s performance against industry standards or your historical data.
This creates a foundation for continuous improvement – much like how athletes track their performance statistics to identify areas for enhancement.

Control Costs
Cost control is another significant benefit. Organizations can identify areas where expenses are higher than necessary by monitoring metrics such as maintenance cost per production unit or energy consumption patterns.
For instance, if repair costs for a specific asset consistently rise, this might signal the need for replacement rather than continued repairs.
Safety and Compliance
KPIs also improve safety and compliance. Tracking incidents, near-misses, and safety inspection completion rates helps organizations maintain a safer workplace and ensure regulatory compliance. These metrics can reveal potential safety issues before accidents or violations occur.
KPI tracking increases employee engagement and accountability. When team members can see how their work directly impacts measurable outcomes, it creates a sense of purpose and responsibility. Consider how different it feels to work towards a specific, measurable goal versus simply going through daily routines without clear metrics for success.
What exactly is Maintenance Matrix?
Think of maintenance metrics as a health dashboard for your equipment and maintenance program – similar to how a doctor uses various measurements to assess a patient’s well-being. Maintenance metrics fall into several key categories:
Equipment Performance Metrics
These measure how well your machinery is functioning. The most fundamental is Mean Time Between Failures (MTBF), which shows the average time equipment operates before breaking down.

For example, if a production line runs for 1,000 hours between breakdowns, that’s your MTBF. A related metric is Mean Time To Failure (MTTF), specifically used for equipment that’s replaced rather than repaired when it fails, like light bulbs or specific electronic components.
Maintenance Response Metrics

These gauges how quickly and effectively your team handles maintenance issues. Mean Time To Repair (MTTR) measures the average time needed to fix equipment after it fails. For instance, if repairing a broken conveyor belt typically takes 3 hours, that’s your MTTR. Overall Equipment Effectiveness (OEE) combines availability, performance, and quality to assess equipment productivity comprehensively.

Cost-Related Metrics
These track the financial aspects of maintenance. Maintenance Cost per Unit of Production helps you understand how much you spend on maintenance relative to your output. For example, if you spend $1,000 on maintenance while producing 10,000 units, your maintenance cost is $0.10 per unit. Another important metric is the Maintenance Cost as a Percentage of Replacement Asset Value (RAV), which helps determine if you’re spending an appropriate amount on maintaining your assets.
Planning and Scheduling Metrics
These evaluate how well you’re managing maintenance activities. Schedule Compliance measures the percentage of planned maintenance tasks completed on time. For instance, if you complete 85 out of 100 scheduled maintenance tasks within their planned timeframe, your schedule compliance is 85%. Planned Maintenance Percentage (PMP) shows how much of your maintenance work is planned versus reactive.
Inventory Metrics
These monitor your maintenance parts and supplies. Inventory Turnover Rate shows how quickly you use and replace parts. Stock-outs track how often you run out of needed parts, which can cause repair delays. For example, if you need a specific bearing for a repair but it’s not in stock, that counts as a stock-out.
Labor Metrics
These assess workforce productivity and efficiency. Wrench Time measures the percentage of time technicians spend performing maintenance tasks versus other activities like gathering tools or traveling to job sites. The labor Utilization Rate shows how effectively you use your maintenance staff’s available hours.
To effectively use these metrics, it’s important to understand that they work together to paint a complete picture. For instance, a low MTBF might be acceptable if your MTTR is very short, or high maintenance costs might be justified if they result in significantly improved equipment reliability.
Get a Free WorkTrek Demo
Let's show you how WorkTrek can help you optimize your maintenance operation.
Try for free


