Get a Free WorkTrek Demo
Let's show you how WorkTrek can help you optimize your maintenance operation.
Try for freeKey Takeaways:
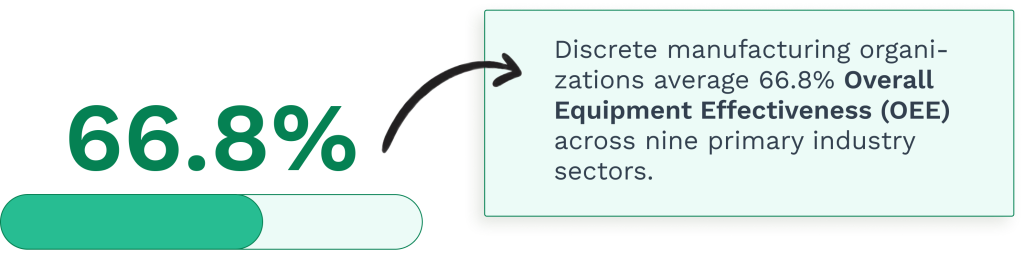
- The average OEE score across discrete manufacturing industries is 66.8% — far below the widely-cited “world-class” benchmark of 85%.
- OEE is not just a maintenance metric: availability, performance, and quality losses all carry equal weight and demand cross-functional ownership.
- A CMMS like WorkTrek gives production teams the real-time data visibility needed to identify hidden inefficiencies and drive meaningful continuous improvement efforts.
Overall equipment effectiveness (OEE) is one of the most widely cited metrics in manufacturing. It shows up in board presentations, lean initiatives, and shop floor dashboards alike.
And yet, despite its widespread use, OEE is also one of the most widely misunderstood metrics in the industry.
Many organizations track it. Far fewer use it correctly.
Misconceptions about how OEE works, what it measures, and what it means for your operations have spread so thoroughly that they’ve begun to undermine the very continuous improvement efforts the metric was designed to support.
In this blog post, we’re setting the record straight.
We’re debunking seven of the most common OEE myths and showing you what high-performing production teams do instead.
Myth #1: 85% OEE Is the Universal World-Class Benchmark
Walk into almost any manufacturing discussion about OEE and someone will eventually say, “world class is 85%.” This figure has been repeated so many times across industry publications, consultancy frameworks, and conference talks that many organizations treat it as gospel.
The reality is considerably more nuanced.
According to data from Evocon, which analyzed OEE scores from more than 3,500 machines across 50+ countries, the average OEE score for most manufacturers falls between 55% and 60%.
Their research further suggests that only around 3% of manufacturers actually achieve a sustained OEE of 85% or higher.
The problem is context.
The “85% = world class” benchmark was developed for high-volume, discrete manufacturing environments with standardized products, high automation, and minimal changeover requirements. It was never intended as a universal target.
A pharmaceutical company managing regulatory batch changeovers, a food and beverage producer handling sanitation requirements, or an aerospace manufacturer producing complex custom components will naturally operate at lower OEE scores.
This is not because they’re performing poorly, but because the nature of their processes demands it.
According to Godlan’s 2025 OEE benchmark report, based on data from 1,470+ discrete manufacturing operations, the average OEE across all industries was 66.8%, with Medical Devices achieving the highest performance at 78.2% and Trailers & RVs recording the lowest at 57.2%.
Godlan Aerospace and defense companies incur an average OEE penalty of over 12% due to engineering complexity and regulatory compliance requirements alone.
What to do instead: Establish your own internal OEE baseline before making external comparisons. Set targets that are realistic for your industry, product mix, and automation level.
Strive for consistent, measurable improvement over time, not a mythical benchmark with little relevance to your actual operations.
Myth #2: OEE Is Only a Maintenance Metric
This is one of the most damaging OEE myths, and one that causes production teams and maintenance departments to work at cross-purposes on the shop floor.
Because machine downtime and equipment failures are among the most visible causes of lost OEE, many organizations assign ownership of the metric entirely to the maintenance department. Maintenance reduces unplanned stops, the thinking goes, and OEE goes up. Simple.
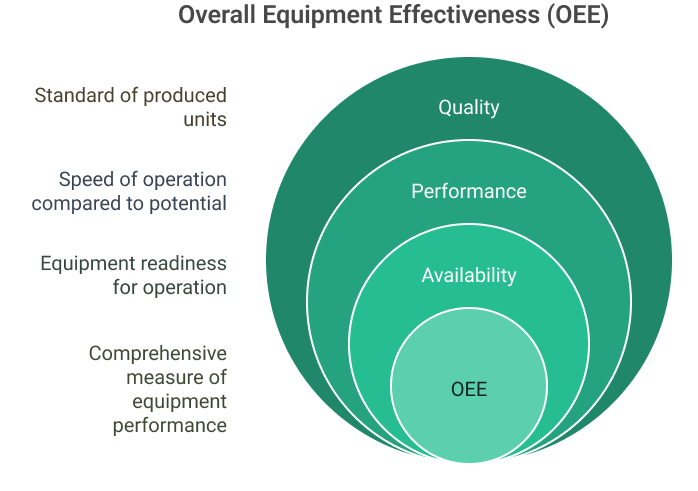
But OEE is a three-factor equation: Availability × Performance × Quality.
OEE takes into account all losses, stop time loss, speed loss, and quality loss, resulting in a measure of truly productive manufacturing time. It is calculated as the ratio of Fully Productive Time to Planned Production Time.
A machine can be perfectly maintained and running continuously, yet still produce a poor OEE score if it’s running at reduced speed due to operator settings, or generating defects due to process conditions.
Performance loss, which includes minor stoppages, slow cycle times, and suboptimal machine speeds, is frequently caused by operator behavior, scheduling decisions, and upstream process conditions.
None of these factors falls under maintenance’s direct control. Quality losses caused by raw material variation, incorrect machine parameters, or inadequate process controls are similarly outside the maintenance function entirely.
The OEE metric measures a machine or plant’s actual productivity and accounts for the three main components — availability, performance, and quality — as well as factors such as equipment or performance losses.
When only one department “owns” OEE, the other contributing factors go unaddressed.
Performance and quality losses become invisible, while all the pressure falls on maintenance to push availability higher and higher. This leaves the majority of hidden inefficiencies untouched.
What to do instead: Treat OEE as a cross-functional metric. Production, quality, engineering, and maintenance teams should all have visibility into OEE data and shared accountability for improvement. Each of the three components deserves equal weight and its own targeted improvement strategy.
Myth #3: A High OEE Score Automatically Means High Profitability
At first glance, this myth seems so logical it barely qualifies as a myth. If your equipment is running effectively, surely that translates to financial results?
Not necessarily.
There is no financial element in an OEE calculation, and it has very little connection to business value.
According to Lnsresearch, it doesn’t factor in the cost of materials, cost of labor, importance of customer, price paid by customer, or even if a customer order exists. Therefore, maximizing the OEE of an asset is not the same as maximizing the profitability of that asset.
Consider a simple example: a machine running at 90% OEE producing parts that are currently in oversupply or that cost more to manufacture than the market price supports.
Pushing OEE even higher doesn’t improve profitability. Conversely, it compounds the problem by generating more unsellable inventory faster.
OEE is an operational metric, not a financial one.
It tells you how efficiently your equipment is being used during scheduled production time. It does not tell you whether that production is contributing to your bottom line.
Confusing the two leads organizations to optimize for the wrong metrics.
That said, OEE improvement does correlate with improved profitability when it’s driven by the right things: reducing waste, lowering costs, and eliminating the need for overtime or additional capital expenditure. The key is context. OEE should be one input into a broader performance management framework, not the sole measure of business health.
What to do instead: Pair OEE data with financial KPIs such as cost per unit, contribution margin, and return on assets. Use OEE to guide maintenance cost management decisions and waste elimination efforts, but don’t mistake a rising OEE score for rising profits without verifying the connection.
Myth #4: Planned Downtime Doesn’t Hurt OEE
Many production teams believe that because planned downtime such as scheduled maintenance, changeovers, calibration runs, and tooling changes. If this is intentional and controlled, it doesn’t count against OEE. After all, you planned for it. It was supposed to happen.
This is a common misconception that causes organizations to systematically underestimate one of their biggest sources of lost productivity.
OEE is the ratio of Fully Productive Time to Planned Production Time.
Availability takes into account Availability Loss, which includes all events that stop planned production for an appreciable length of time, including both Unplanned Stops, such as equipment failures, and Planned Stops, such as changeover time.
What OEE does exclude is schedule loss. This is the time when the machine was never intended to run, such as nights, weekends, or holidays.
But any time a machine is scheduled for production and is instead stopped, whether by surprise failure or by a scheduled changeover, that time counts as an availability loss.
This distinction matters enormously for preventive maintenance planning. If maintenance tasks are scheduled during active production windows, or if changeovers routinely run long due to poor preparation, those losses show up directly in your OEE score.
The goal is not to eliminate planned downtime. The goal should be to optimize it.
World-class manufacturers apply techniques like SMED (Single-Minute Exchange of Die) and reliability-centered maintenance to shrink the time windows needed for planned activities. This can help you recover productive capacity without sacrificing machine reliability.
What to do instead: Audit your planned downtime events. Measure their actual duration against targets. Identify where changeovers or preventive maintenance activities routinely run over schedule, and apply continuous improvement methods to bring those durations down.
Myth #5: You Can Aggregate OEE Across Different Machines and Plants
Roll-up OEE reporting is common.
Many organizations calculate an average OEE for an entire production line, then for a plant, then present a single enterprise-wide OEE figure to leadership. It’s clean, it’s simple, and in most cases, it’s largely meaningless.
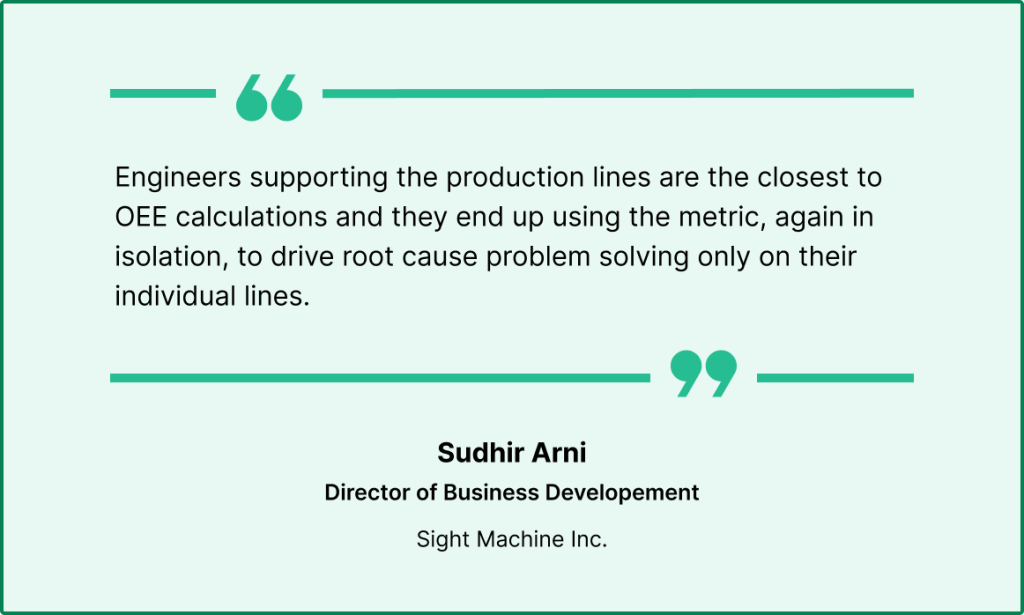
People have begun to place the emphasis on the “O” in OEE instead of where it belongs – on the “E’s.”
The trend is for manufacturers to take their total output, average availability of all equipment, and planned design production capacity, and generate a single OEE metric for the entire operation.
As industry-by-industry benchmarks show, there is wide variation in OEE, much of which stems from the fact that very different equipment is used to manufacture different products. Even within an industry, the processes and equipment to make one product may vary significantly from those used to make another.
Think about what a blended OEE score actually represents when it mixes a high-speed automated stamping press with a manual assembly station, a CNC machining center, and a batch mixing tank.
Each of those assets has different theoretical maximum speeds, different cycle times, different types of losses, and entirely different improvement levers. Averaging their OEE scores into a single number obscures every root cause and makes it nearly impossible to prioritize improvement efforts meaningfully.
The original intent of OEE was always equipment-level visibility — understanding how effectively every single piece of production equipment is being used to execute its intended purpose.
The only time an aggregate plant or process number has any real meaning is if we are comparing identical plants, with identical equipment, manufacturing identical products from identical raw materials. In reality, for most manufacturers, that condition simply doesn’t exist.
What to do instead: Measure and track OEE at the individual machine or asset level. Use equipment-level data to identify which specific assets are the biggest contributors to lost productivity, and focus your continuous improvement efforts there. Reserve aggregate reporting for trend tracking over time, not for cross-asset comparisons.
Myth #6: OEE Improvement Requires Massive Capital Investment
This myth is especially damaging because it causes manufacturers to do nothing at all.
The reasoning goes: we can’t afford new equipment right now, so there’s nothing we can do to improve OEE. Capital budgets are tight. We’ll revisit it next year.
But OEE improvement doesn’t require large capital expenditures. When production machinery operates more efficiently, production times drop, along with resource usage and maintenance demands. In the end, this leads to lower costs.
According to USC Consulting Group in the event that production needs to scale upward due to increased market demand or expansion, the existing machinery is ready to support such growth without the need for new capital investment.
Many of the most impactful OEE improvements come from operational changes that cost little or nothing:
- Standardizing changeover procedures
- Training operators on optimal machine settings
- Improving shift handover communication
- Make OEE data visible to frontline workers so they can act on it in real time.
Toyota’s implementation of the Toyota Production System emphasizes just-in-time production, error-proofing, and continuous improvement through kaizen.
These strategies have allowed Toyota not only to meet but also to sustain high OEE scores over time, largely through process discipline rather than constant capital reinvestment.
The tools to improve OEE are often already in your facility. What’s frequently missing is the data infrastructure to identify where losses are occurring, and the process discipline to address them systematically.
What to do instead: Start by improving measurement accuracy. You can’t eliminate waste you can’t see. Invest in data collection systems and CMMS platforms that provide visibility into downtime events, cycle time deviations, and quality losses.
Then apply lean continuous improvement methods to address root causes before considering capital equipment investment.

Myth #7: A Single OEE Number Tells You Everything You Need to Know
Perhaps the most seductive myth of all: that a plant manager can glance at an OEE score of, say, 72% and immediately know what’s wrong and what to fix.
They can’t.
OEE is a composite metric. The same overall score can be produced by dozens of different combinations of availability, performance, and quality values. Each score points to entirely different problems with entirely different solutions.
Two facilities with identical OEE scores of 72% could have almost nothing in common operationally.
Each of the three components of OEE points to an aspect of the process that can be targeted for improvement. These losses are further subdivided into what is known as the “Six Big Losses” in order to make the data more universally applicable and to better reflect the financial impact of the losses.
Without drilling down into those components, an OEE headline number is like a body temperature reading: it tells you something is off, but not what or where.
Modern manufacturers who use OEE effectively go far beyond the top-line metric.
They analyze the six big losses:
- Breakdowns
- Setup and adjustment time
- Minor stoppages
- Reduced speed
- Startup rejects
- Production rejects
They correlate OEE data with specific shifts, operators, products, and time windows to identify patterns. They use predictive analytics to anticipate where the next losses are likely to emerge before they happen.
The targeted analysis and differentiation of value-adding and unproductive activities is crucial for optimizing OEE in the long term.
Digitalization opens up completely new possibilities for making OEE calculation more efficient and accurate, enabling companies not only to calculate OEE automatically but also to react immediately to issues and identify ways to improve.
What to do instead: Always analyze OEE at the component level, availability, performance, and quality, before drawing conclusions. Use the six big losses framework to categorize the specific types of waste driving your score down. Make OEE data available to frontline production teams in real time, not just as a lagging indicator in a weekly management report.
How a CMMS Helps You Improve OEE the Right Way
Understanding the myths is only half the battle. Fixing the underlying issues requires the right tools — and specifically, the right data.
This is where a CMMS (Computerized Maintenance Management System) becomes indispensable for production teams serious about OEE improvement.
A CMMS connects directly to the three root causes behind every OEE loss:
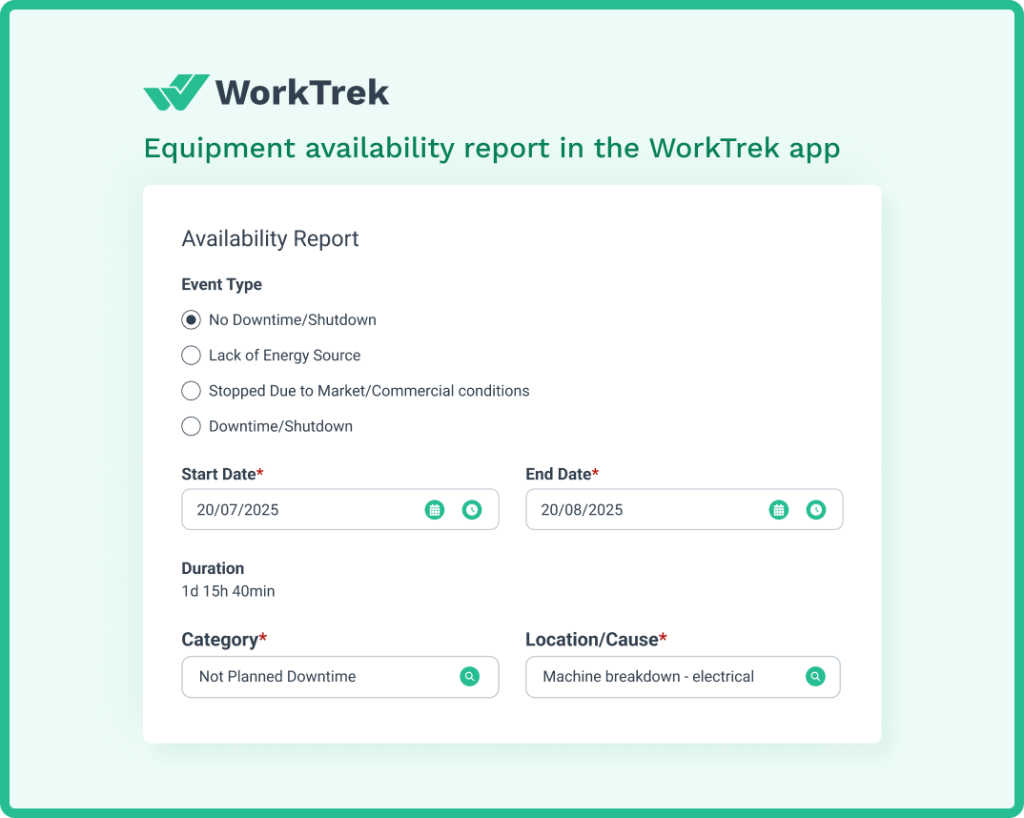
Availability losses are primarily driven by unplanned machine downtime and excessive planned downtime durations. A CMMS automates preventive maintenance scheduling to reduce unplanned failures, and gives maintenance managers the data they need to optimize maintenance windows and minimize disruption to planned production time.
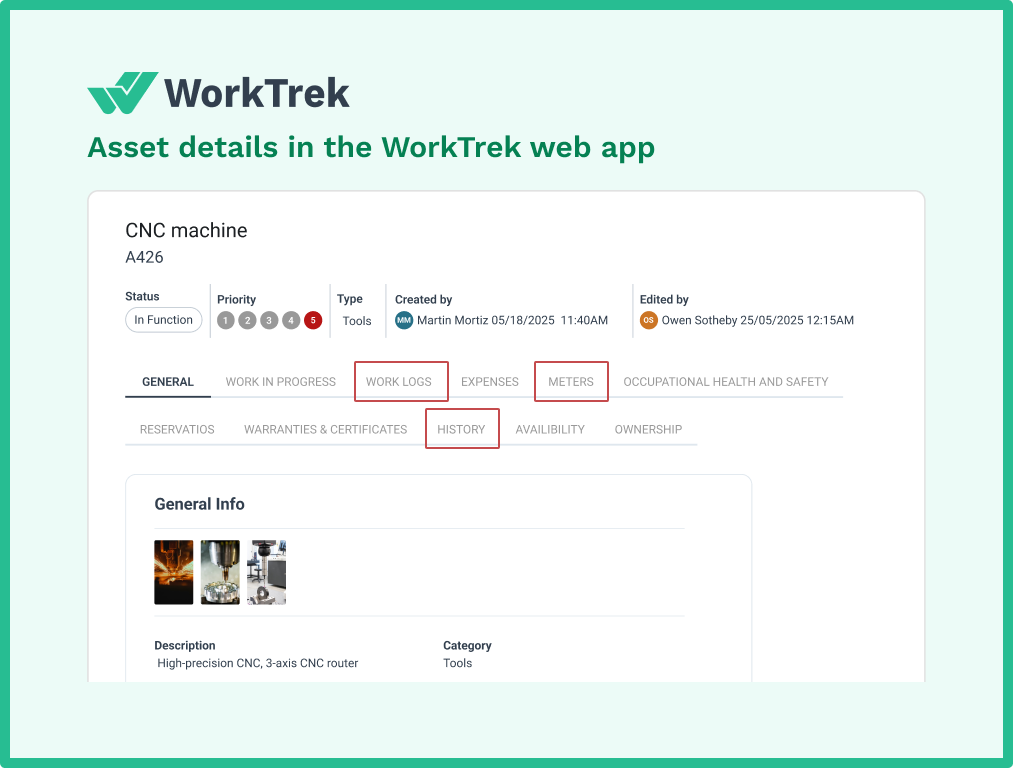
Performance losses caused by minor stoppages, slow cycle times, and suboptimal machine conditions are often linked to deferred maintenance, aging components, and inadequate lubrication or calibration schedules. A CMMS tracks full asset history, flags deteriorating performance trends early, and ensures nothing falls through the cracks between shifts.
Quality losses driven by tooling wear, poor machine calibration, or inconsistent operating conditions are often traceable to maintenance gaps. A CMMS maintains complete records of maintenance history and inspection outcomes, making it far easier for engineering and quality teams to correlate defect events with specific maintenance activities and address the actual root causes.
Conclusion
OEE is a genuinely powerful metric when it’s understood and applied correctly. The problem has never been the metric itself. It’s the myths that have grown up around it.
Chasing an 85% benchmark that doesn’t apply to your industry, treating overall equipment effectiveness as a maintenance-only concern, aggregating OEE across dissimilar assets, or interpreting the top-line number without examining its three components can result in mistakes that divert energy from the meaningful improvements actually available to you.
The manufacturers who get real value from OEE are the ones who dig into the data, challenge their assumptions, and address the actual root causes of their losses
With the right approach and the right tools, your OEE program can become one of the most powerful drivers of operational excellence on the production floor.