Get a Free WorkTrek Demo
Let's show you how WorkTrek can help you optimize your maintenance operation.
Try for freeKey Takeaways:
- Only 15% of equipment failures are age-related, while 85% follow random failure patterns that require different maintenance approaches.
- United Airlines’ landmark study identified six distinct failure patterns, with infant mortality accounting for 68% of all component failures.
- Organizations using condition-based maintenance to address random failures can reduce unplanned downtime by up to 50% while extending asset life.
Equipment doesn’t just randomly fail. Even though it may seem that way. Behind every breakdown lies a predictable pattern that, once understood, can transform your entire maintenance strategy.
For decades, maintenance teams operated under a simple but flawed assumption: the older the equipment, the more likely it is to fail. This belief led to expensive time-based overhauls, excessive maintenance, and unnecessary component replacements that did little to improve equipment reliability.
Then researchers discovered something that changed everything.
Multiple studies, including the groundbreaking work by F. Stanley Nowlan and Howard F. Heap, for United Airlines in 1978, revealed that equipment failures follow distinct, measurable patterns. More importantly, they found that only a small percentage of failures actually occur due to aging.
Understanding these common equipment failure patterns isn’t just an academic exercise—it’s the foundation of modern reliability-centered maintenance. When you know how and why assets fail, you can develop targeted maintenance strategies that prevent failures, reduce downtime, and avoid unnecessary costs.
What Are Equipment Failure Patterns?
Equipment failure patterns are recurring trends that describe how the conditional failure probability changes over a component’s operating age. Think of them as the characteristic “signatures” that different types of equipment leave behind as they move through their lifecycle.
Before the 1960s, maintenance thinking relied heavily on fixed overhauls and defined maintenance periods. The prevailing wisdom suggested that regular scheduled maintenance would keep equipment running reliably. However, in-service experience showed little improvement in asset performance despite diligent adherence to planned maintenance schedules.
According to research published by Nowlan and Heap, this traditional approach was ineffective and mostly counterproductive.
Their study of United Airlines’ commercial aircraft revealed that many maintenance interventions actually increased the probability of failure by introducing new defects or infant mortality failures during the initial phase after component replacement.
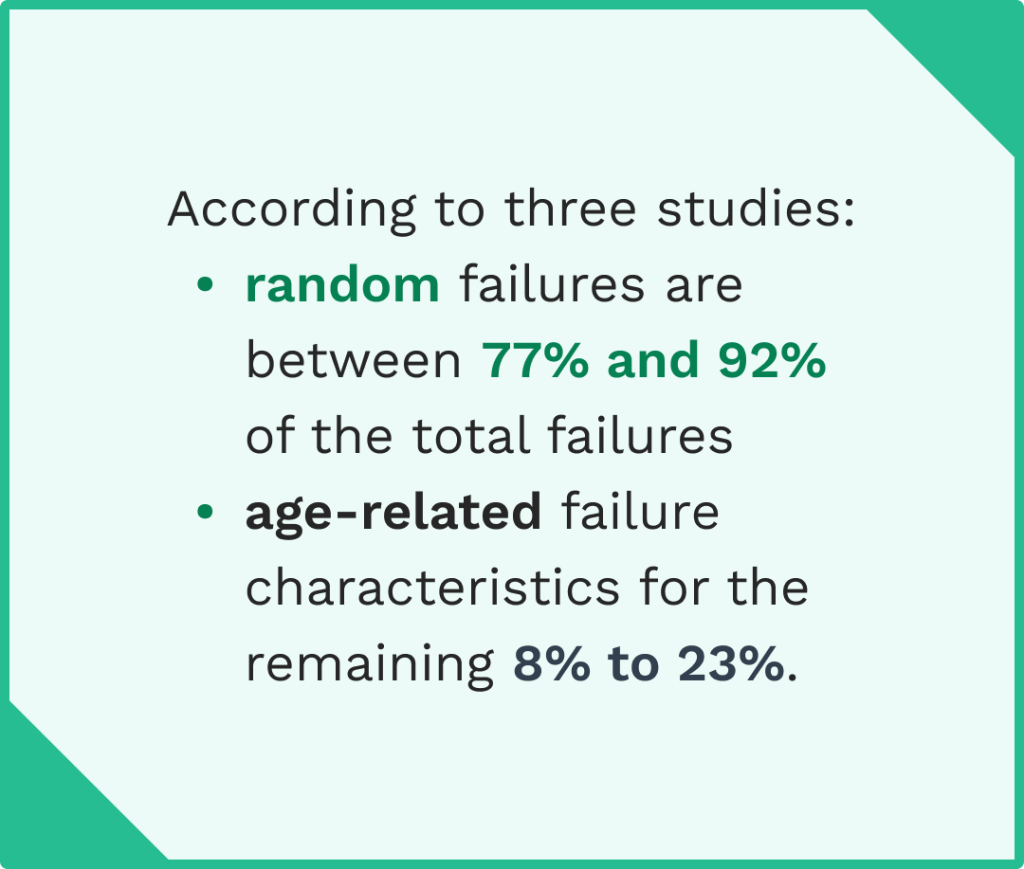
To improve equipment reliability, organizations needed to understand the root causes behind failures. This led to three landmark studies that identified distinct equipment failure patterns:
- United Airlines Study (1978): Nowlan and Heap’s analysis of civil aviation maintenance data formed the foundation of reliability-centered maintenance and advanced approaches to maintenance diagnosis to identify the root causes of equipment failures
- Swedish Study (1992): Broberg’s research validated similar patterns across different industries
- SUBMEPP Study (1998): The Naval Sea Systems Command analyzed submarine maintenance data, generating age and reliability curves that allowed the Navy to eliminate many time-directed overhauls
These studies revealed a surprising truth: different components subject to different operating conditions exhibit unique failure behaviors.
Some wear out predictably over time, while others fail randomly throughout their lifecycle. Understanding which pattern your equipment follows determines whether preventive tasks will actually improve equipment reliability or simply waste resources.
The six failure patterns these researchers identified account for virtually all equipment failures in industrial operations. Each pattern reflects a different relationship between a component’s operating age and its failure probability, which has direct implications for your maintenance strategy.
The Six Failure Patterns Explained
Pattern A: The Bathtub Curve
The bathtub curve is the most recognized failure pattern, and for good reason—it’s what most people intuitively expect from equipment performance.
This pattern shows three distinct phases:
- Infant Mortality Phase: High failure rates at the start of operating life due to manufacturing defects, installation errors, or other early-stage issues
- Useful Life Phase: A long period of stable, low random failure probability
- Wear-Out Zone: Increasing failure rates as the component ages and deteriorates
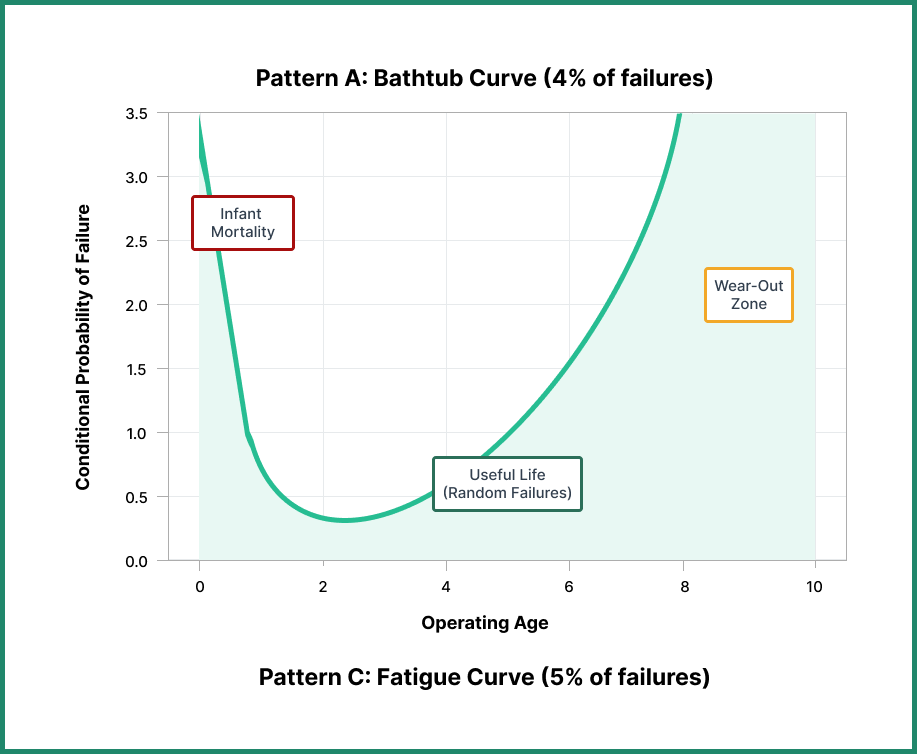
The curve represents the ideal scenario in which components can be replaced before entering the wear-out zone, thereby avoiding failures. However, organizations must first overcome the increased risk of initial failure before settling into a consistently low random failure probability.
According to the United Airlines study, only 4% of components conformed to the bathtub curve failure pattern. Subsequent studies by Broberg found 3%, while SUBMEPP reported 6%.
Common examples of components that exhibit bathtub failures include:
- Electrical components like computer hard-disk drives or current relays that, once “burnt in,” run at low failure rates until they wear out from age and use
- Sleeve bearings in large diesel engines, where early failures occur due to bedding-in problems before settling into long operational periods
Pattern B: The Wear-Out Curve
The wear-out failure pattern shows a stable, low level of random failures for most of a component’s life, followed by a sharp increase in failure probability toward the end of its useful life. In effect, this is the bathtub curve without the infant mortality phase.
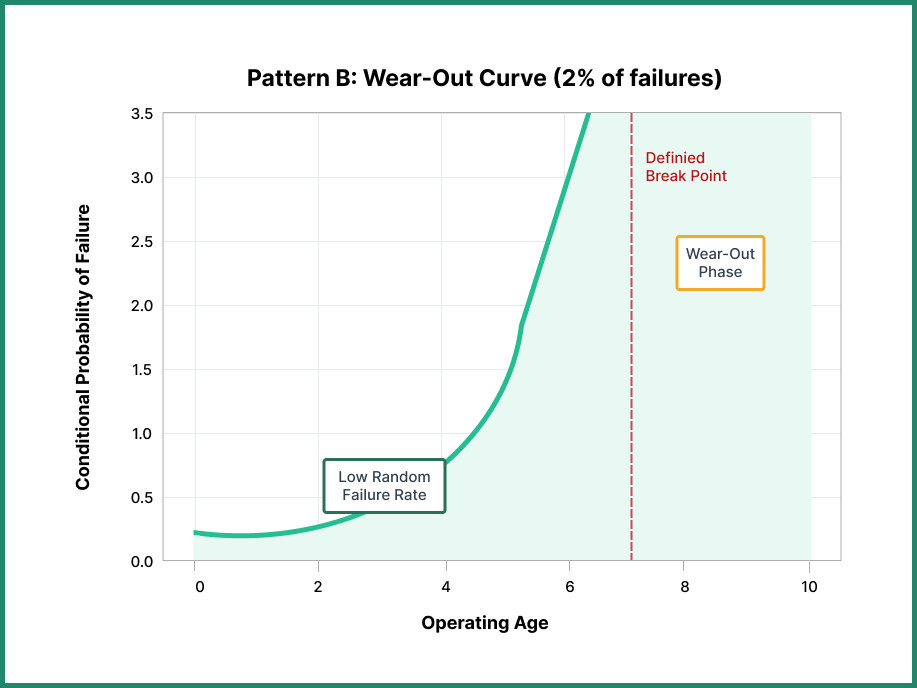
This lack of infant mortality might result from rigorous manufacturing quality systems that eliminate defective components before they reach the field, or simply from the nature of the component itself.
Replacing components subject to this pattern before they enter the wear-out phase is an effective way to improve equipment reliability. The defined break point makes planning preventive maintenance straightforward—you know exactly when intervention will provide value.
Research shows that 2% of components in the UAL study showed the wear-out failure pattern, 1% in Broberg’s study, and a significantly higher 17% in SUBMEPP’s research.
Classic examples include phosphor-bronze or white-metal bushes. These components operate well when properly lubricated and maintained, but as they age, shaft clearances increase, accelerating wear until vibration or leakage occurs. The pattern reflects a clear relationship between operating age and failure probability.
Pattern C: The Fatigue Curve
The fatigue curve represents a constant increase in failure probability as the component ages. Unlike the wear-out curve, there’s no defined break point before which you can plan replacement with certainty.
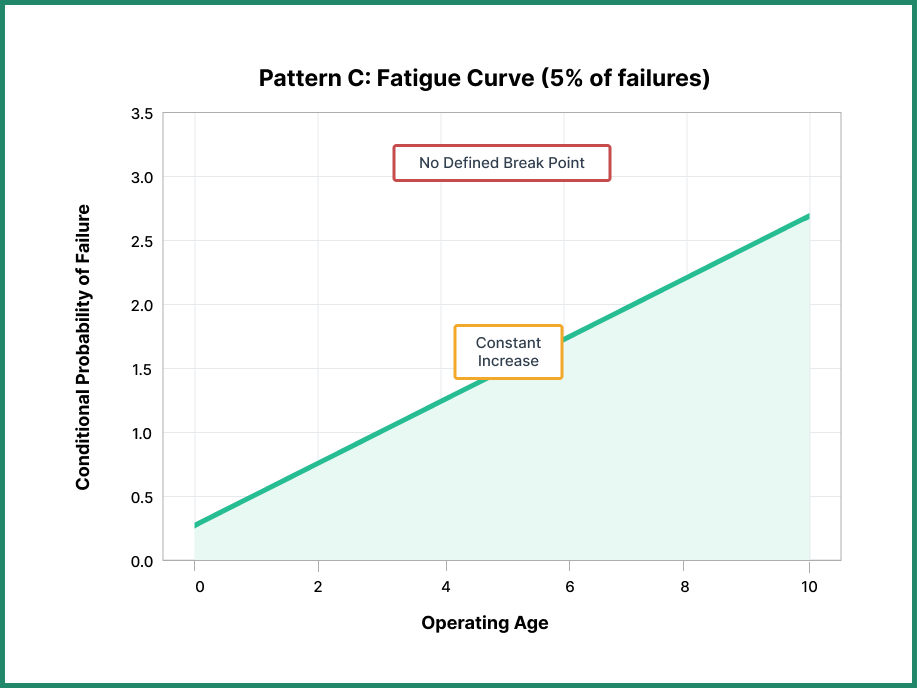
Components subject to cyclical loads gradually accumulate damage over time. Each stress cycle brings the component closer to failure, but predicting exactly when it will fail is challenging. The failure increases steadily rather than remaining stable until a specific age.
With this pattern, you replace the component once the failure probability reaches an unacceptable level for your business operations. This requires continuous monitoring rather than simple time-based maintenance.
This pattern accounts for 5% of failures in the UAL study, 4% in Broberg, and 0% in the submarine service (likely due to different operating conditions and component types).
Components that commonly exhibit this pattern include:
- Gear teeth subjected to repetitive loading
- Springs that experience constant compression and extension cycles
- Drive shafts handling variable torque loads
These mechanical systems accumulate fatigue damage over their operational life, making vibration analysis and other condition-monitoring techniques essential for detecting early warning signs before catastrophic failure.
Pattern D: The Break-In Curve
The break-in curve shows a very low probability of failure at the beginning of a component’s life. The failure probability increases during the early stages, then settles to a constant conditional probability for the remainder of the component’s life.
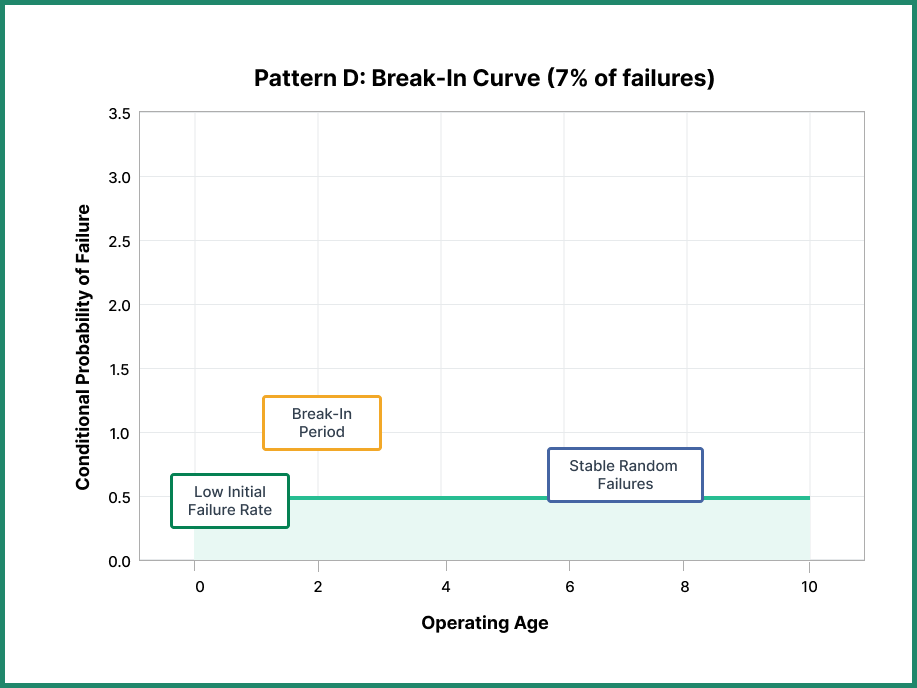
This pattern is counterintuitive—the component is actually more reliable when brand new, and its reliability decreases slightly as it breaks in before stabilizing. Consequently, there’s no value in replacing this component to improve reliability. The initial phase of slightly elevated failures represents such a small percentage of the overall component’s life that preventive replacement would be counterproductive.
According to research, 7% of failures at UAL followed this pattern, 11% in the Swedish study, and 0% in submarine service.
Examples of components exhibiting break-in failures include:
- Capacitance level sensors, where manufacturers capture manufacturing defects before shipping, but in-service environmental factors cause some early failures before the population settles intoa random failure mode
- Various electrical components that experience similar break-in behavior
Pattern E: The Random Failure Pattern
The random pattern shows constant failure probability throughout a component’s entire lifecycle. Unlike age-related failures, the curve represents equipment whose failure probability doesn’t increase or decrease with time—it remains constant regardless of operating age.
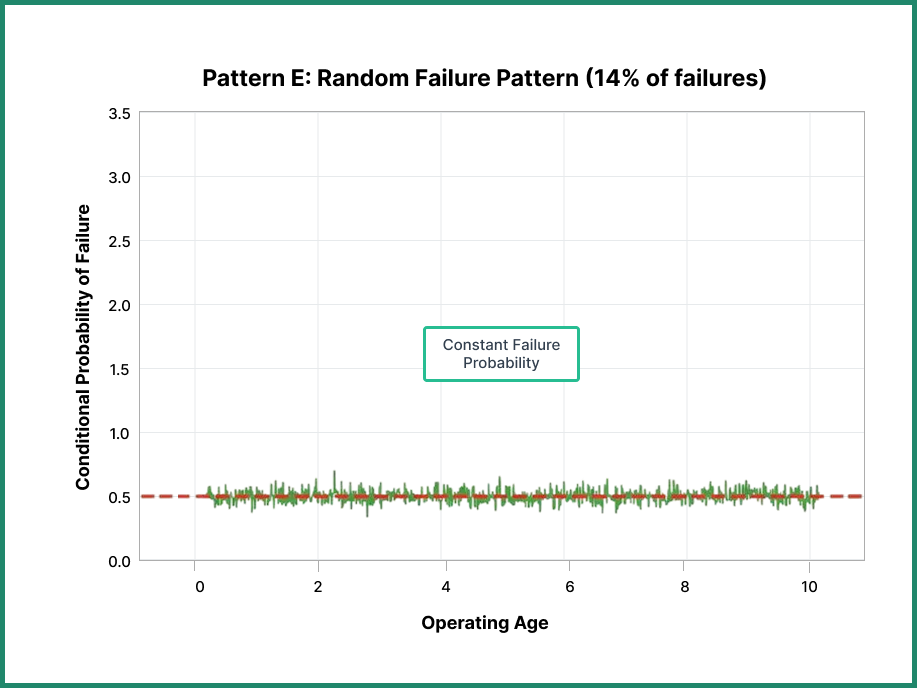
No optimum time exists to replace components following this pattern. Preventive replacement provides zero benefit because a new component has the same failure probability as the existing one. In fact, replacement might increase risk by introducing installation errors or initial-phase issues.
This pattern might seem rare, but it actually accounts for 14% of UAL failures, 15% at Broberg, and an impressive 42% at SUBMEPP.
Common scenarios include:
- Random events like pump suction debris, operator errors, or external damage
- Solid-state memory chips with implicit self-correction mechanisms
- Components that fail due to seemingly infinite external causes
When these random events are aggregated across a large population, they produce a constant failure rate. Many organizations mistakenly apply preventive tasks to components following this pattern, wasting resources on unnecessary maintenance that doesn’t reduce the conditional probability of failure.
Pattern F: The Infant Mortality Curve
The infant mortality curve mirrors the start of the bathtub curve, exhibiting high failure probability during the initial phase of life before settling into a steady random failure probability for the remainder of the component’s operational life.
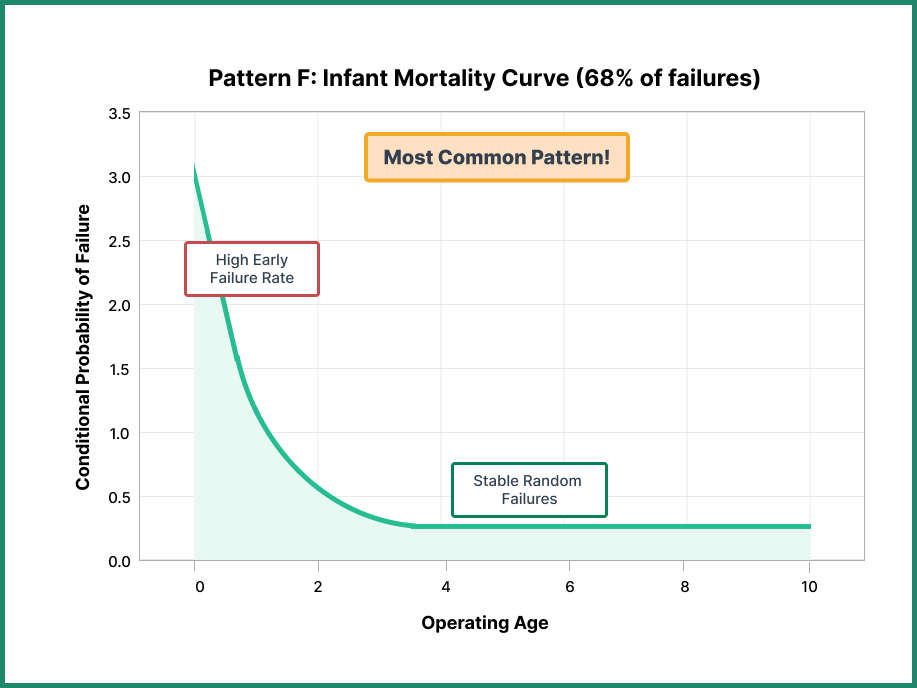
This is the most common failure pattern—and the most misunderstood. Components following this pattern are actually more likely to fail when new or recently serviced. The failure increases dramatically in the early stages before stabilizing.
Preventive replacement of components following this pattern doesn’t just provide zero benefit—it actually increases failure probability by introducing a new infant mortality phase. Every time you replace the component, you restart the cycle of elevated risk.
This pattern is strikingly prevalent: 68% of all Nowlan & Heap’s components exhibited infant mortality behavior, along with 66% in the Swedish study and 29% of submarine service components.
Components that typically follow this pattern include:
- Complex equipment without dominant failure modes, where the assembly of multiple components creates an infant mortality period, even if individual parts might follow other patterns
- CPUs and video processing chips that exhibit early failures before settling into constant low-level failure rates
- Integrated systems where multiple failure modes combine to create initial instability
Age-Related vs. Random Failures
Understanding the distinction between age-related and random failures fundamentally changes how you approach maintenance.
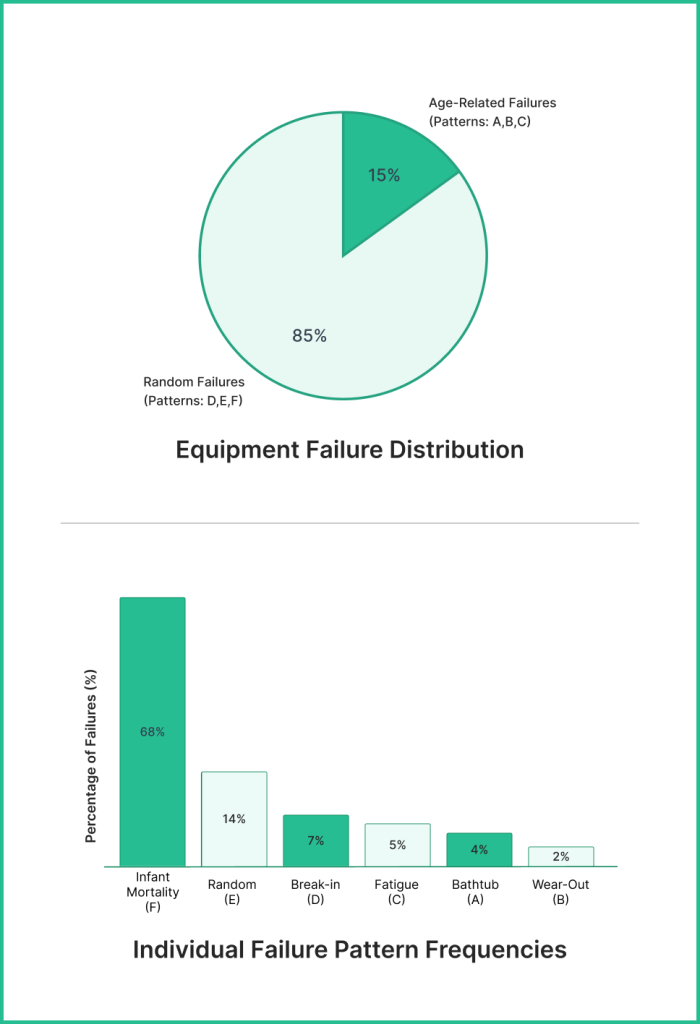
Age-Related Failures (Patterns A, B, and C) represent approximately 15% of all equipment failures. These are components where failure probability increases once the part reaches a certain age, operating hours, or cycle count. Wear and corrosion are typical root causes of age-related failures.
For these components:
- Time-based preventive maintenance delivers clear value
- You can define a component’s useful life with reasonable accuracy
- Replacing components before the defined break point improves overall reliability
- Predictive maintenance based on operating age makes economic sense
Random Failures (Patterns D, E, and F) account for approximately 85% of all components. These failures occur independently of age, often due to manufacturing defects, random events, or environmental factors during the initial phase.
For these components:
- Time-based preventive maintenance provides minimal value and may actually harm reliability
- Scheduled overhauls introduce unnecessary costs and potential installation errors
- Condition-based maintenance offers better results than calendar-based schedules
- Continuous monitoring helps detect potential failure before it occurs
This 85/15 split reveals why traditional time-based maintenance strategies often fail to deliver expected improvements in equipment reliability. The majority of your equipment simply doesn’t benefit from age-based interventions.
According to research from Deloitte’s study on predictive maintenance, organizations that shift from purely time-based to condition-based approaches see 10-40% reduction in maintenance costs and 50% reduction in downtime for assets subject to random failures.
How Understanding Failure Patterns Improves Maintenance Strategy
Knowing your equipment failure patterns transforms maintenance from reactive firefighting to proactive asset management. Instead of applying the same maintenance approach to all equipment, you can match strategies to actual failure behaviors.
Targeting Preventive Tasks Where They Matter
For the 15% of components exhibiting age-related failures (Patterns A, B, C), preventive maintenance delivers measurable value. You can establish clear maintenance schedules based on operating hours, calendar time, or production cycles.
For instance, components subject to the wear-out pattern benefit from scheduled replacement before entering the wear-out zone. A well-designed preventive maintenance program for these assets reduces unexpected breakdowns and improves operational efficiency.
However, applying preventive tasks to the 85% of components with random or infant mortality patterns wastes resources. These components require different approaches, like condition-based maintenance, continuous monitoring, or run-to-failure strategies, depending on their criticality.
Reducing Excessive Maintenance
Many organizations perform far more maintenance than necessary. When you understand failure patterns, you can identify and eliminate preventive tasks that don’t improve equipment reliability.
Components following the infant mortality curve (Pattern F) are a prime example. Every preventive replacement restarts the infant mortality phase, actually increasing failure probability. For these assets, the best strategy is often continuous monitoring with replacement only upon evidence of imminent failure.
A study by the Institution of Mechanical Engineers found that organizations optimizing their maintenance based on failure patterns reduced their maintenance burden by 30% while improving asset reliability by 25%.
Implementing Condition-Based Maintenance
For components with random failures, condition-based maintenance offers the best approach. Rather than servicing equipment on a fixed schedule, you monitor for early warning signs that indicate increasing failure probability.
Condition monitoring techniques include:
- Vibration analysis to detect bearing wear, imbalance, or misalignment
- Oil analysis to identify contamination or component degradation
- Thermal imaging to spot electrical hotspots or mechanical friction
- Ultrasonic testing to find leaks or bearing issues
These techniques help detect early signs of failure in mechanical systems before a breakdown occurs, allowing you to plan replacements during scheduled downtime rather than face emergency repairs.
Planning Predictive Maintenance
Combining condition-monitoring data with machine learning enables predictive maintenance, in which analytics engines assess all possible failure modes and predict how long a component will continue operating.
According to Siemens’ research, organizations implementing predictive maintenance report:
- 20% reduction in unplanned downtime
- 25% increase in equipment uptime
- 10% decrease in maintenance costs
- 20% improvement in downtime forecasting accuracy
Predictive maintenance is particularly valuable for components following random failure patterns, where traditional time-based approaches fail to improve equipment reliability.
Avoiding Common Pitfalls
Understanding failure patterns helps avoid several maintenance pitfalls:
- Over-maintaining infant mortality components: Replacing these creates more problems than it solves
- Under-maintained wear-out components: These need scheduled replacement before failure
- Applying universal maintenance schedules: Different patterns require different strategies
- Ignoring warning signs on random failures: Condition monitoring is essential for these assets
The key is matching your maintenance strategy to each component’s actual failure behavior rather than applying a one-size-fits-all approach to every asset.
How CMMS Software Helps Manage Equipment Failure Patterns
Effective failure pattern management requires consistent data collection, analysis, and action—tasks that quickly overwhelm manual systems. This is where a modern CMMS becomes essential for operational excellence.
Tracking Failure History and Patterns
A CMMS platform automatically logs every work order, inspection, and meter reading against specific assets. Over time, this creates a comprehensive failure history that reveals which pattern each component follows, supporting a predictive maintenance strategy.
For example, if a pump consistently fails within 30 days of replacement despite varying operating hours, it likely exhibits an infant mortality pattern. Conversely, if failures cluster after a specific hour threshold regardless of calendar time, you’re seeing a wear-out pattern.
WorkTrek excels at capturing and organizing this asset reliability data. Every maintenance activity, from routine inspections to emergency repairs, gets timestamped and linked to the specific equipment. This creates a complete picture of each asset’s life cycle and failure modes.
Implementing Condition-Based Maintenance
For the 85% of components with random failures, traditional scheduled maintenance doesn’t improve reliability. These assets require condition-based strategies, where maintenance is performed based on actual equipment condition rather than fixed intervals.
WorkTrek supports both time-based and condition-based preventive maintenance scheduling. You can set up automated work orders triggered by:
- Calendar intervals for age-related failures
- Meter readings (operating hours, cycles, production counts)
- Sensor thresholds for temperature, vibration, or other indicators
- Inspection findings that identify early signs of deterioration
This flexibility ensures you’re applying the right maintenance strategy to each component based on its actual failure pattern.
Detecting Early Warning Signs
Components rarely fail without warning, even those exhibiting random patterns. Subtle changes in vibration, temperature, or performance often precede failures. The challenge is detecting these warning signs consistently across your entire asset base.
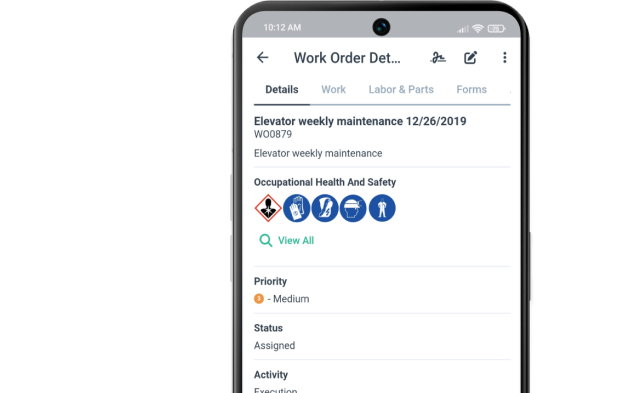
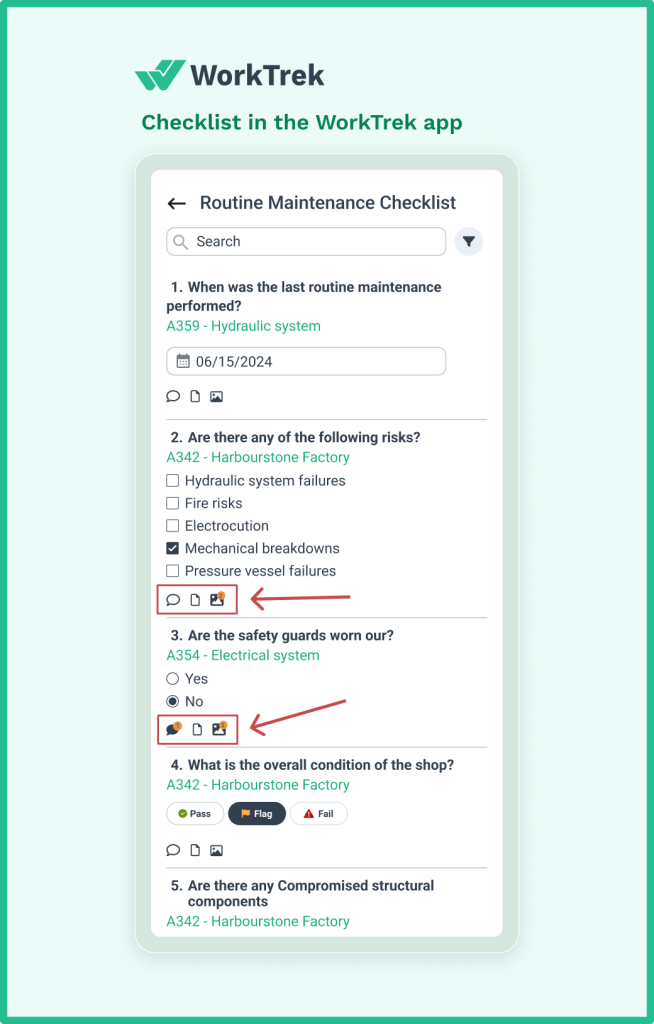
WorkTrek’s inspection and checklist features enable technicians to systematically capture condition data during routine rounds. They can log observations, attach photos, and record measurements directly in the mobile app.
When readings fall outside acceptable ranges, WorkTrek automatically generates work orders, ensuring potential failures get addressed before they cause unplanned downtime. This transforms your maintenance team from reactive responders to proactive problem-solvers.
Optimizing Preventive Maintenance Schedules
Not all preventive maintenance is created equal. Tasks that reduce failures for wear-out components (Pattern B) may actually increase failures for infant mortality components (Pattern F).
WorkTrek’s analytics help identify which preventive tasks actually improve equipment reliability versus those that just consume resources. By analyzing failure rates before and after specific maintenance activities, you can optimize your PM program to focus on high-value interventions.
For instance, if bearing replacements on Pattern F components consistently trigger failures within the infant mortality phase, you might shift to condition-based replacement instead. This data-driven approach eliminates excessive maintenance while reducing unexpected breakdowns.
Managing Spare Parts Inventory
Understanding failure patterns also informs your spare parts strategy. Components with predictable wear-out patterns require different inventory approaches than those with random failures.
For age-related failures, you can forecast part requirements based on operating hours and planned replacements. For random failures, you need strategic stock levels based on failure frequency and component criticality.

WorkTrek automatically tracks part usage and triggers reorder notifications when inventory falls below defined thresholds. This ensures critical spares are available when needed without tying up excessive capital in unnecessary inventory.
Connecting Teams and Data
Effective failure pattern management requires collaboration between maintenance technicians, reliability engineers, and operations staff. Everyone needs access to accurate asset information and failure history.
WorkTrek provides a centralized platform where:
- Technicians access detailed work instructions and asset histories via mobile devices
- Engineers analyze failure trends and optimize maintenance strategies
- Managers monitor key metrics like Mean Time Between Failures (MTBF) and Mean Time To Repair (MTTR)
- Operations staff submit work requests and track issue resolution
This connectivity ensures knowledge doesn’t get siloed in spreadsheets or lost with personnel changes. Your understanding of failure patterns becomes institutional knowledge that improves over time.
Enabling Continuous Improvement
The best maintenance programs evolve based on actual results. WorkTrek’s reporting and analytics make it easy to track improvements in equipment reliability, maintenance costs, and asset reliability over time.
Custom dashboards display the metrics that matter most to your organization. This could be KPIs related to reducing unplanned downtime, extending asset life, or minimizing maintenance costs. You can segment data by equipment type, location, or failure mode to identify specific areas for improvement.
This visibility into operational excellence enables data-driven decisions about where to invest maintenance resources for maximum impact. Rather than spreading efforts equally across all assets, you focus on improvements that deliver measurable results.
Conclusion
Understanding common equipment failure patterns is practical information that directly impacts your maintenance effectiveness and operational efficiency.
The research is clear: only 15% of equipment failures are truly age-related, while the vast majority follow patterns that don’t benefit from traditional time-based maintenance. When you recognize which pattern each component follows, you can eliminate unnecessary costs, reduce downtime, and extend asset life.
The shift from time-based to pattern-based maintenance represents a fundamental change in maintenance strategy. Instead of asking “when should we service this equipment?” you ask “what failure pattern does this equipment exhibit, and what maintenance approach best addresses that pattern?” To explore solutions for implementing pattern-based maintenance management, you can book a demo of WorkTrek.
Modern CMMS platforms like WorkTrek make this pattern-based approach practical and scalable. By centralizing asset data, automating condition monitoring, and optimizing maintenance schedules based on actual equipment behavior, these systems help you move from reactive repairs to proactive asset management.
Many organizations continue operating under outdated maintenance philosophies, performing excessive maintenance on some equipment while neglecting others that need attention. The failure patterns identified decades ago by Nowlan and Heap remain relevant today—but only a fraction of organizations apply this knowledge effectively.