Get a Free WorkTrek Demo
Let's show you how WorkTrek can help you optimize your maintenance operation.
Try for freeKey Takeaways:
- Unplanned downtime costs the world’s 500 biggest companies $1.4 trillion annually.
- 65% of companies use CMMS software to track and optimize maintenance performance metrics.
- Equipment failures account for 42% of all unplanned downtime incidents.
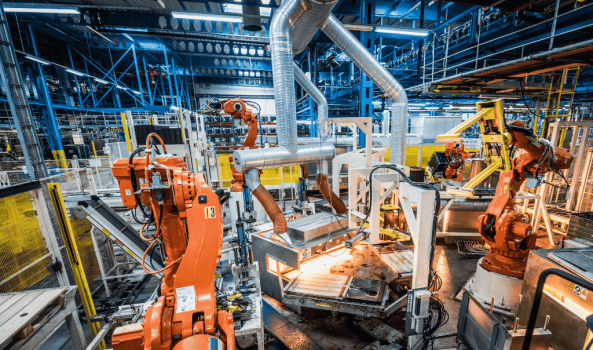
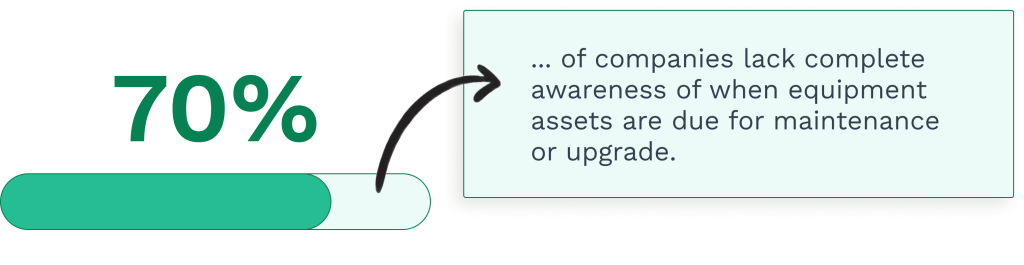
Every piece of equipment in your facility tells a story through data. If you are not tracking, it is likely that you are missing some critical information and valuable opportunities to reduce downtime.
Equipment failure metrics provide measurable insights into how well your maintenance team performs, where vulnerabilities exist in your systems, and what actions you need to take to prevent costly breakdowns before they happen.
In this guide, we’ll explore seven essential equipment failure metrics you should be tracking, why they matter, and how modern CMMS technology makes monitoring these key performance indicators easier than ever.
Why Equipment Failure Metrics Matter
The financial impact of equipment failures has reached staggering proportions.
According to Siemens’ 2024 True Cost of Downtime report, unplanned downtime saps 11% of annual revenues from the world’s 500 biggest companies. That is a staggering total of $1.4 trillion, which is a large increase from $864 billion in 2019.
For individual facilities, the numbers are equally alarming.
In the automotive industry, a single hour of downtime at a large plant costs up to $2.3 million, or roughly $600 per second.
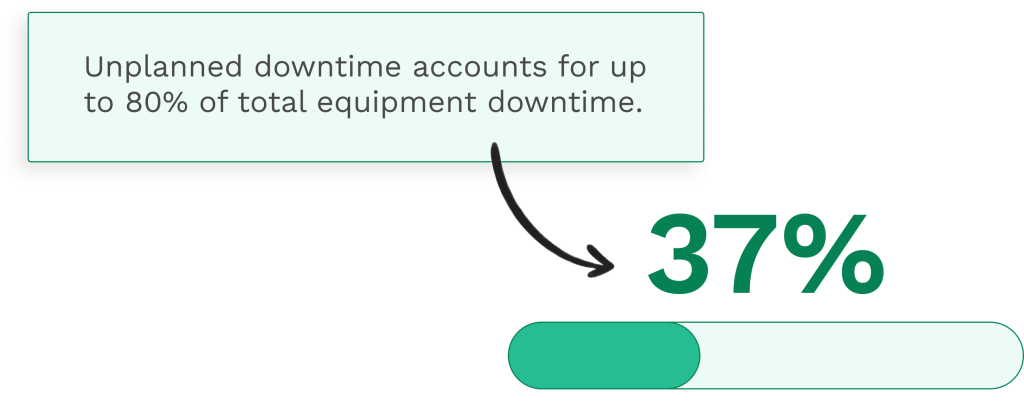
But here’s what makes tracking failure metrics so powerful: equipment failures account for approximately 42% of unplanned downtime incidents, meaning nearly half of your production losses are preventable with the right maintenance strategy.
Multiple failure metrics give you the data you need to shift from reactive maintenance to proactive maintenance approaches that minimize downtime and reduce costs.
The challenge is knowing which metrics to track.
The 7 Critical Equipment Failure Metrics
Let’s examine the seven equipment failure metrics that provide the most actionable insights for your maintenance operations.
1. Mean Time to Repair (MTTR)
Mean time to repair measures the average time your maintenance team takes to repair failed equipment and restore it to full operational status.
This metric tracking starts when a failure occurs and ends when the equipment is back in service.
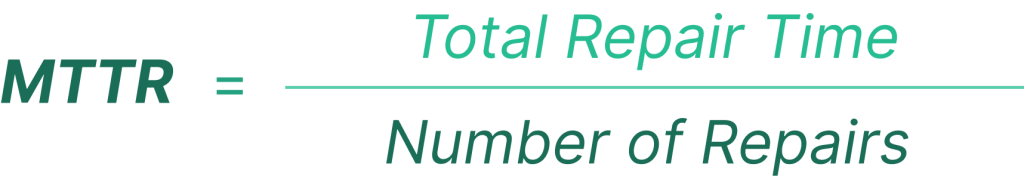
Here’s the formula:
MTTR = Total Repair Time ÷ Number of Repairs
For example, if your maintenance team spent 100 hours fixing a specific asset over the past year, and that asset failed 10 times during that time period, your MTTR would be 10 hours.
Why MTTR Matters
MTTR is one of the most common failure metrics because it directly measures your maintenance team’s efficiency in responding to system failures.
A lower MTTR means your team can diagnose problems quickly, has the right parts on hand, and can execute repair processes effectively.
According to MaintainX’s 2024 State of Industrial Maintenance report, the average time to complete unplanned maintenance work varies significantly across industries, but reducing MTTR consistently delivers measurable cost savings.
MTTR includes several components. To better understand the importance of predictive maintenance and its impact on maintenance strategies, check out these key statistics about predictive maintenance.
- Time to detect the failure
- Time to notify the maintenance team
- Time to diagnose the root causes
- Time to obtain the necessary parts
- Actual repair time
- Time to test and restart the equipment
By breaking down these components, you can identify bottlenecks in your repair processes and make targeted improvements.
2. Mean Time Between Failures (MTBF)
The mean time between failures (MTBF) is the average operational time between failures for repairable systems.
This is a critical maintenance performance metric that measures asset reliability rather than repair speed.
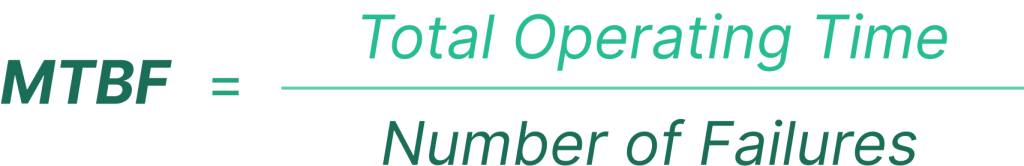
The calculation is straightforward:
MTBF = Total Operational Hours ÷ Number of Failures
If an asset ran for 20,000 hours over the past year and experienced four system failures, your MTBF would be 5,000 hours.
Why MTBF Matters
MTBF tells you how reliable equipment is under normal operating conditions.
A higher MTBF indicates more reliable equipment that experiences fewer production interruptions. This metric helps maintenance managers forecast when failures are likely to occur and schedule preventive maintenance accordingly.
When calculating MTBF, you include time spent on preventive maintenance but exclude time spent on repairs. This gives you a true picture of how long equipment runs between failure events.
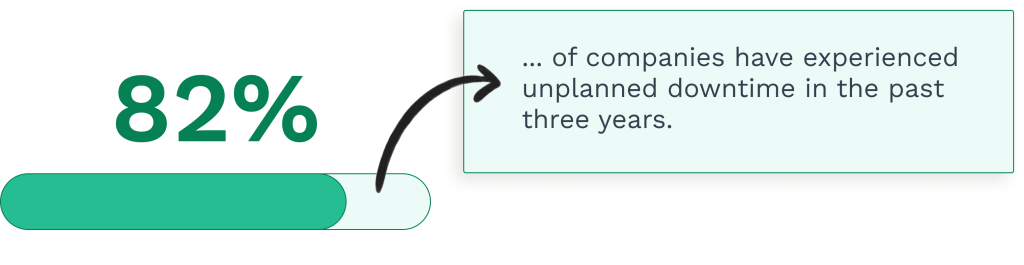
According to ABB’s 2023 Maintenance and Reliability Survey, more than two-thirds of companies experience unplanned downtime events weekly or even daily, highlighting why tracking MTBF is essential for improving asset reliability.
3. Mean Time to Failure (MTTF)
Mean time to failure measures the expected lifespan of non-repairable assets—items that must be replaced rather than repaired when they fail.

Unlike MTBF, which applies to repairable systems, MTTF is calculated for components like:
- Bearings
- Motors
- Conveyor belts
- Light bulbs
- Filters
The formula is:
MTTF = Total Operational Hours ÷ Number of Assets
Suppose you installed 40 motors last year, and by year’s end, all had failed after a combined 20,000 hours of operation. Your MTTF would be 500 hours.
Why MTTF Matters
MTTF helps you plan replacement schedules and manage spare parts inventory more effectively.
When you know the average time a specific asset operates before product or system failure, you can proactively order replacements and schedule installation during planned downtime rather than scrambling during an emergency.
This metric is particularly valuable for inventory management, allowing you to stock the right parts in the right quantities without tying up excessive capital in spare parts.
4. Overall Equipment Effectiveness (OEE)
Overall equipment effectiveness is a comprehensive metric that measures how well your equipment performs compared to its theoretical maximum output.
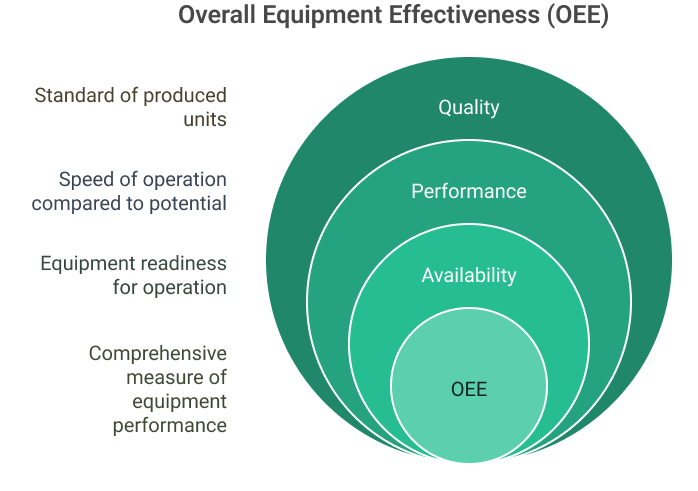
OEE combines three factors:
- Availability – The percentage of scheduled time that equipment is available for production
- Performance – How fast the equipment runs compared to its designed speed
- Quality – The percentage of products that meet quality standards
The formula is:
OEE = Availability × Performance × Quality
An OEE score of 100% means you’re manufacturing only good parts, as fast as possible, with no unplanned downtime.
In reality, world-class manufacturers typically achieve OEE scores of 85% or higher. Metrics such as Mean Time Between Failure (MTBF) also play a crucial role in assessing equipment reliability.
Why OEE Matters
OEE provides a holistic view of equipment effectiveness by accounting for multiple failure modes:
- Availability losses from system failures, changeovers, and unplanned maintenance
- Performance losses from slow cycles, minor stops, and reduced speed
- Quality losses from defects and rework
By tracking OEE alongside other maintenance metrics, you can identify which factor most limits your productivity and focus improvement efforts accordingly.
According to industry research, manufacturers experience an average of 25 downtime incidents per month, and large plants lose 27 hours per month to unplanned downtime. All of these are factors that directly impact OEE scores.
5. Planned Maintenance Percentage (PMP)
Planned maintenance percentage measures what portion of your total maintenance work is scheduled in advance versus reactive.
This is one of the most revealing indicators of a maintenance program’s health.
The calculation:
PMP = (Planned Maintenance Hours ÷ Total Maintenance Hours) × 100
If your team spent 800 hours on planned maintenance and 200 hours on emergency repairs last month, your PMP would be 80%.
Why PMP Matters
A higher planned maintenance percentage indicates a more proactive maintenance strategy.
Teams with high PMP scores experience fewer emergencies, better resource utilization, and more predictable maintenance costs.
According to UpKeep’s 2024 State of Maintenance Report, 65% of respondents identified proactive maintenance as the most effective way to reduce unplanned downtime incidents.
However, the same research found that while 86.8% of facilities use preventive maintenance strategies, almost 60% dedicate less than half of their total maintenance time to them.
This highlights a critical gap between intention and execution.
Industry best practice targets a PMP of 85% or higher, meaning at least 85% of your maintenance activities should be planned rather than reactive.
6. Maintenance Backlog
Maintenance backlog measures the amount of approved maintenance work waiting to be completed.
This metric helps maintenance managers understand resource allocation and whether the maintenance team can keep pace with demand.
The calculation typically uses labor hours:
Maintenance Backlog = Total Hours of Approved Work Orders Not Yet Completed
A healthy backlog is typically 2-4 weeks of work. Too little backlog suggests your team may not have enough work planned ahead. Too much indicates your team is overwhelmed and falling behind.
Why Maintenance Backlog Matters
Tracking your maintenance backlog helps you:
- Identify staffing needs
- Prioritize critical maintenance work
- Prevent the accumulation of deferred maintenance
- Balance preventive maintenance with corrective work
An increasing backlog often signals that your team needs additional resources, better planning, or more efficient troubleshooting techniques.
According to WorkTrek’s maintenance cost statistics, managing backlog effectively is essential for controlling maintenance costs, as work that gets continuously deferred often becomes more expensive to address later.
7. Schedule Compliance
Schedule compliance measures how effectively your maintenance team completes planned work on time.
This metric reveals whether your preventive maintenance schedule is realistic and achievable.
The formula:
Schedule Compliance = (Work Orders Completed On Time ÷ Total Scheduled Work Orders) × 100
If you scheduled 100 preventive maintenance tasks last month and completed 85 of them on or before their due dates, your schedule compliance would be 85%.
Why Schedule Compliance Matters
Low schedule compliance often indicates one or more problems:
- Unrealistic maintenance schedules
- Insufficient staffing
- Poor parts availability
- Excessive emergency work interrupts planned tasks
- Inadequate maintenance planning
High schedule compliance (typically 90% or above) indicates your team has effective processes, adequate resources, and realistic schedules.
This metric is particularly valuable when paired with PMP. If both metrics are high, your maintenance operations are well planned and well executed. If PMP is high but schedule compliance is low, you may have planning problems or resource constraints.
How CMMS Software Helps Track Failure Metrics
Manually calculating and tracking multiple failure metrics across dozens or hundreds of assets is nearly impossible without dedicated software.
That’s where a CMMS (Computerized Maintenance Management System) becomes essential.
According to UpKeep’s research, 65% of companies now use CMMS software to manage maintenance activities and track key performance indicators.
How WorkTrek Automates Metric Tracking
WorkTrek makes tracking failure metrics effortless by automatically collecting data throughout your entire maintenance process.
Here’s how it works:
Automatic Time Tracking
Every time a technician receives a work order, starts a repair, and completes the task, WorkTrek automatically logs the timestamps. This real-time data feeds directly into MTTR calculations without any manual entry.

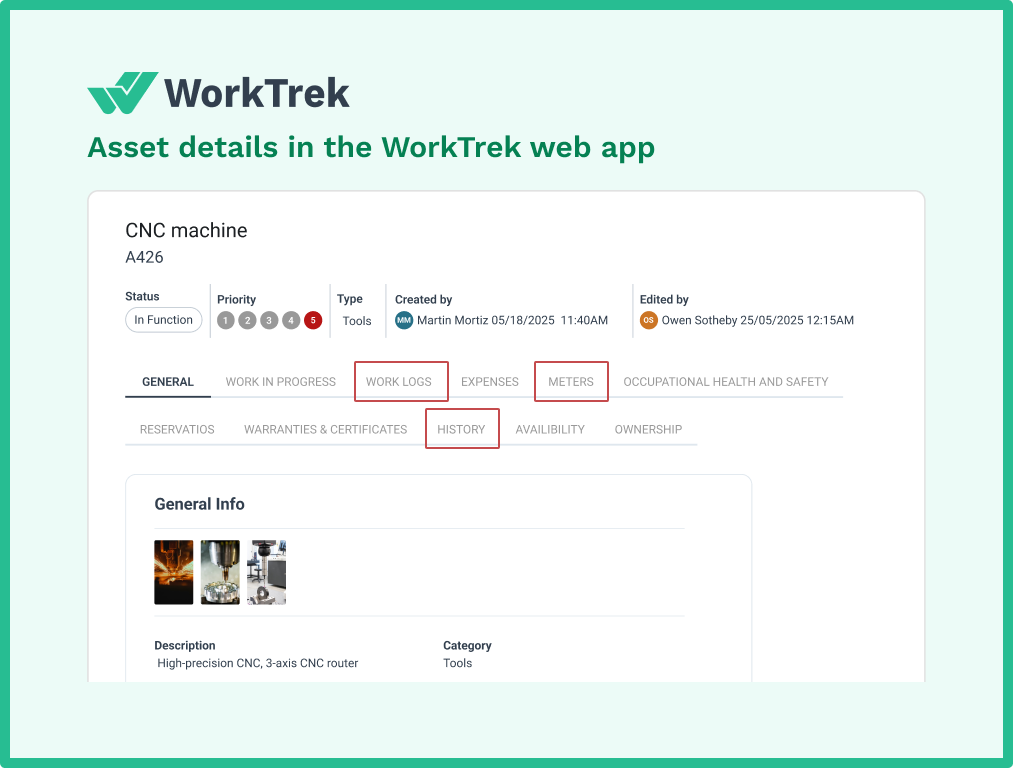
Asset Performance Monitoring
WorkTrek tracks every failure event for each asset in your system. The software maintains a complete maintenance history and automatically calculates MTBF and MTTF based on operational hours and failure frequency.
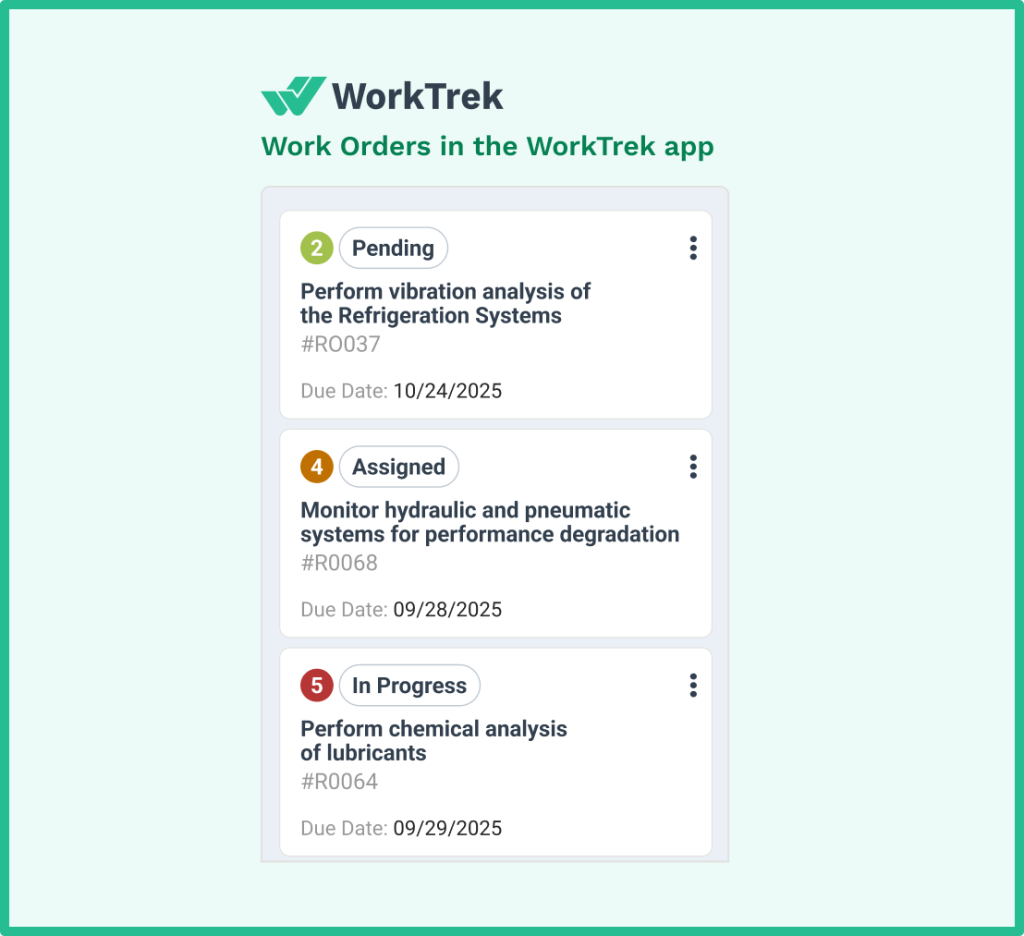
Work Order Classification
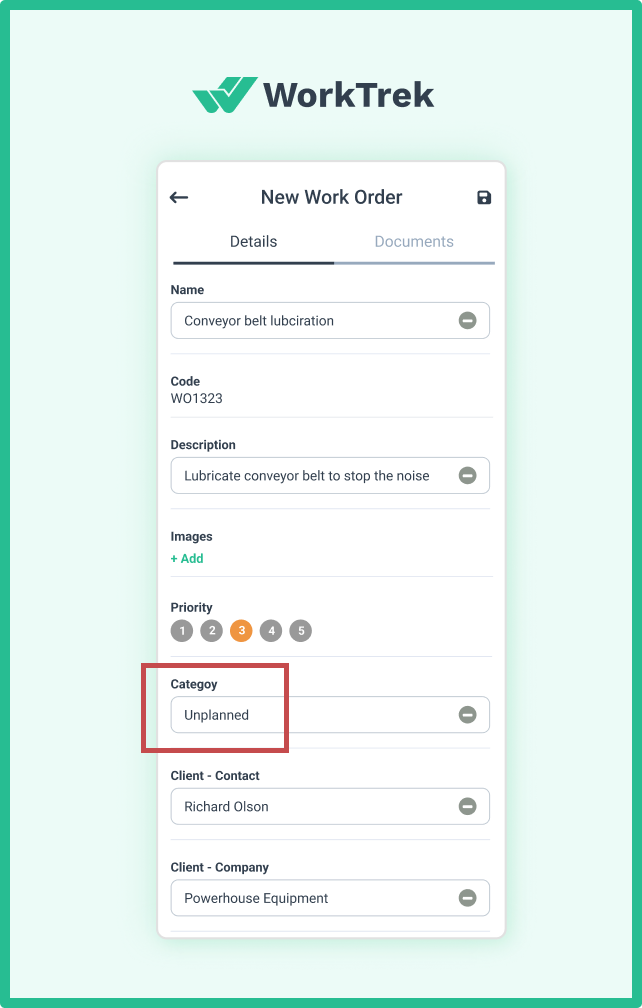
WorkTrek categorizes work orders as planned or unplanned, enabling the system to automatically calculate your planned maintenance percentage. You can see at a glance whether you’re spending too much time fighting fires instead of preventing them.
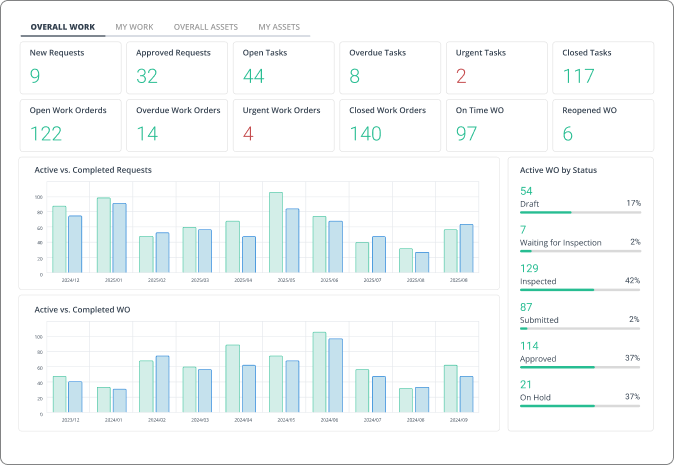
Built-In Analytics and Reporting
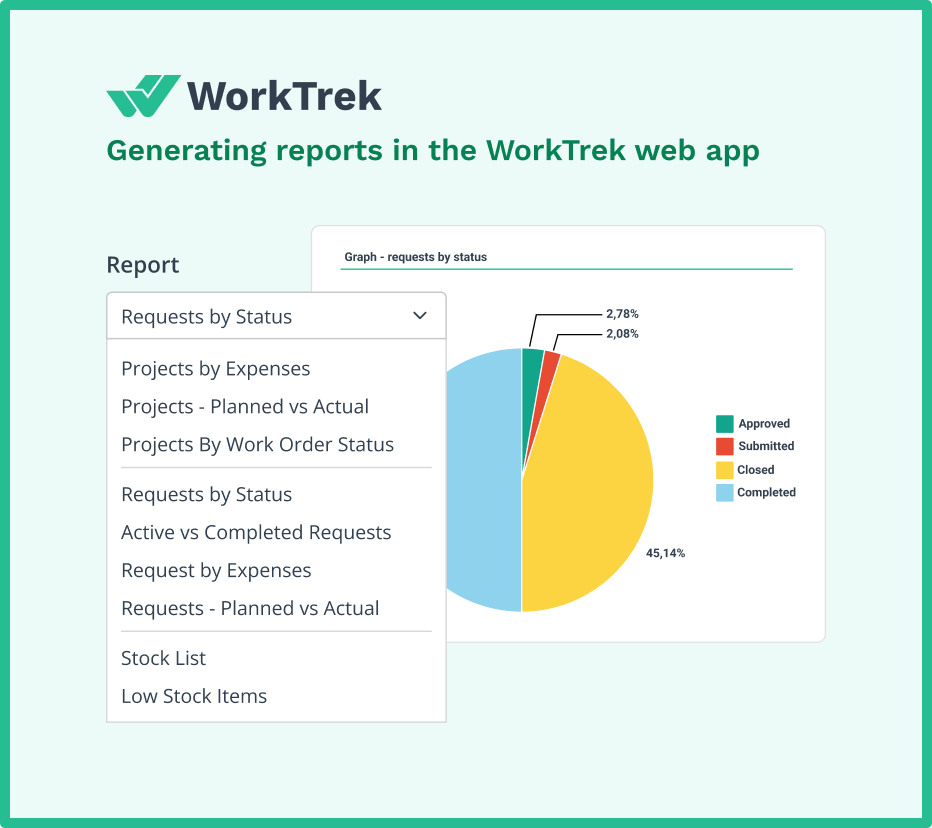
Rather than exporting data to spreadsheets and manually creating charts, WorkTrek provides over 50 pre-built reports and more than 20 pre-built KPIs.
These dashboards display your failure metrics in real-time, making it easy to spot trends and identify areas for improvement.
Preventive Maintenance Scheduling
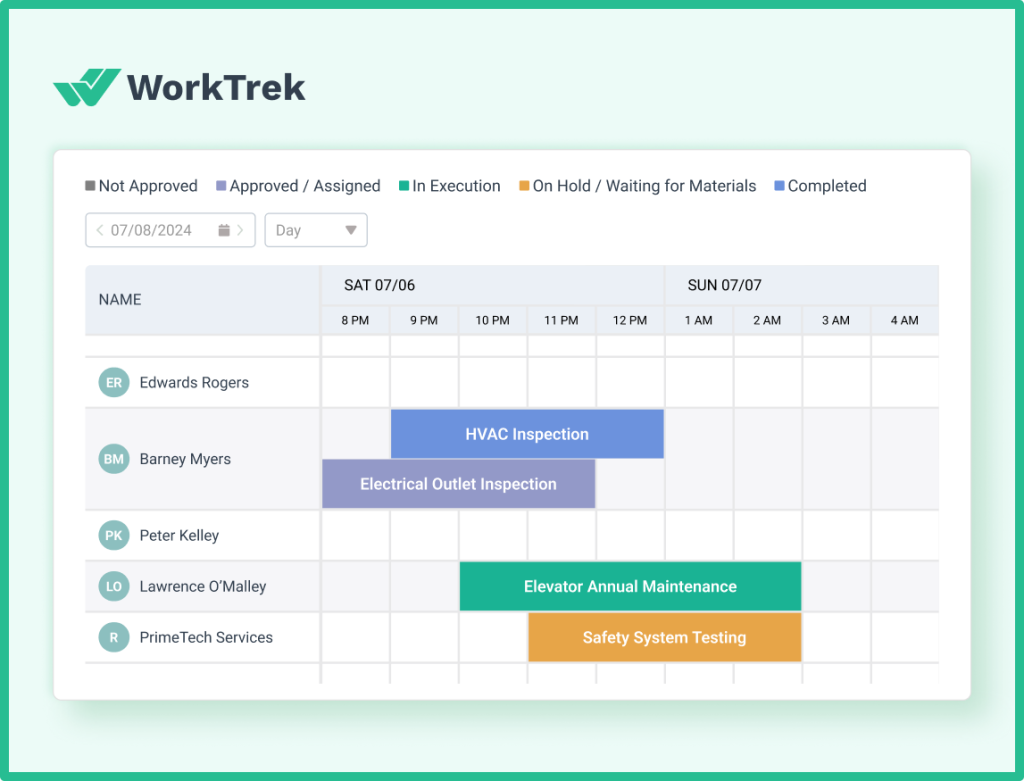
WorkTrek’s preventive maintenance features help you create schedules based on time, meter readings, or actual asset conditions. The system automatically generates work orders and tracks schedule compliance, showing you exactly which preventive tasks are completed on time.
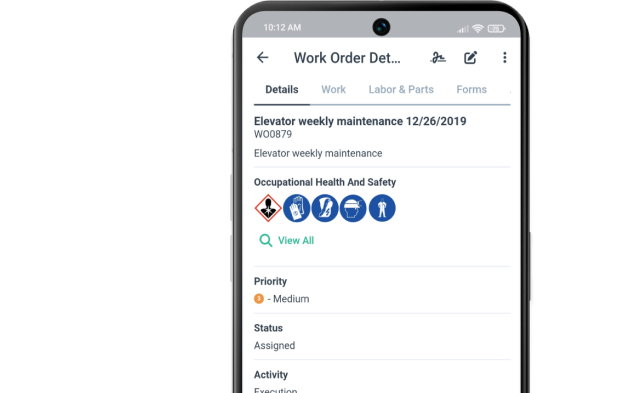
Mobile Access for Faster Response
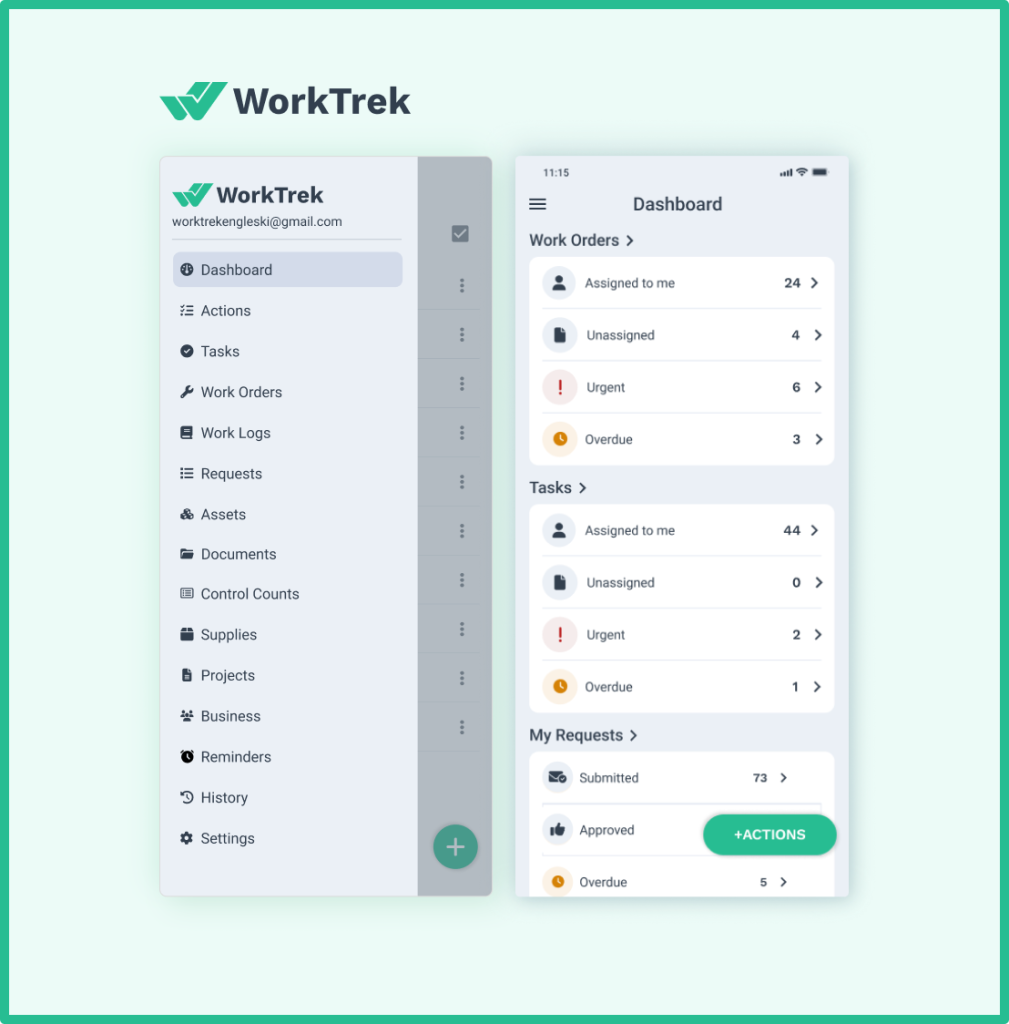
With WorkTrek’s mobile app, technicians can access work orders, update status, and log completion data from anywhere in your facility. This reduces repair time and improves the accuracy of your MTTR calculations.
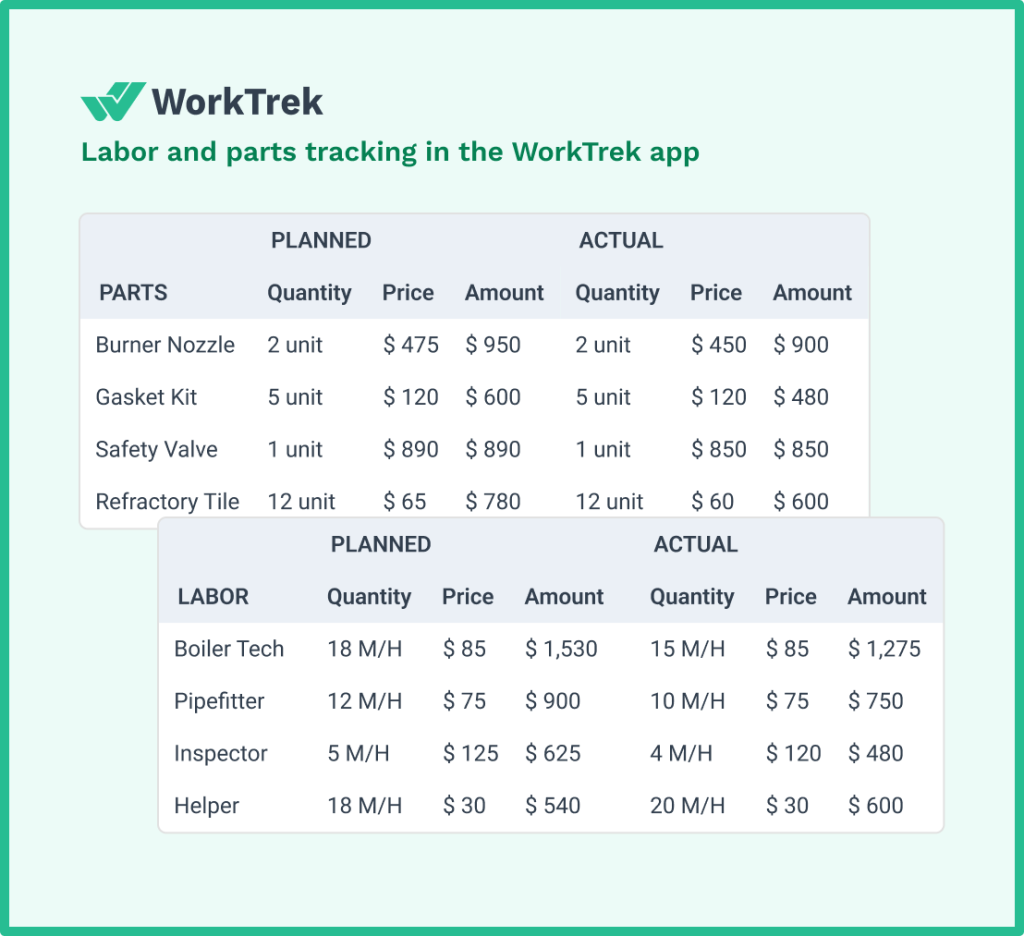
Parts and Inventory Integration
For optimal operational efficiency, it’s important to understand the relationship between inventory management and maintenance strategies. You can learn more about the differences between unplanned and planned maintenance and how they impact parts usage, downtime, and long-term asset health.
WorkTrek integrates parts and inventory management directly into the maintenance workflow.
When parts are assigned to work orders and used during repairs, the system automatically updates inventory levels and can trigger reorder notifications.
This integration helps reduce the time technicians spend hunting for parts, which is a major contributor to extended MTTR.
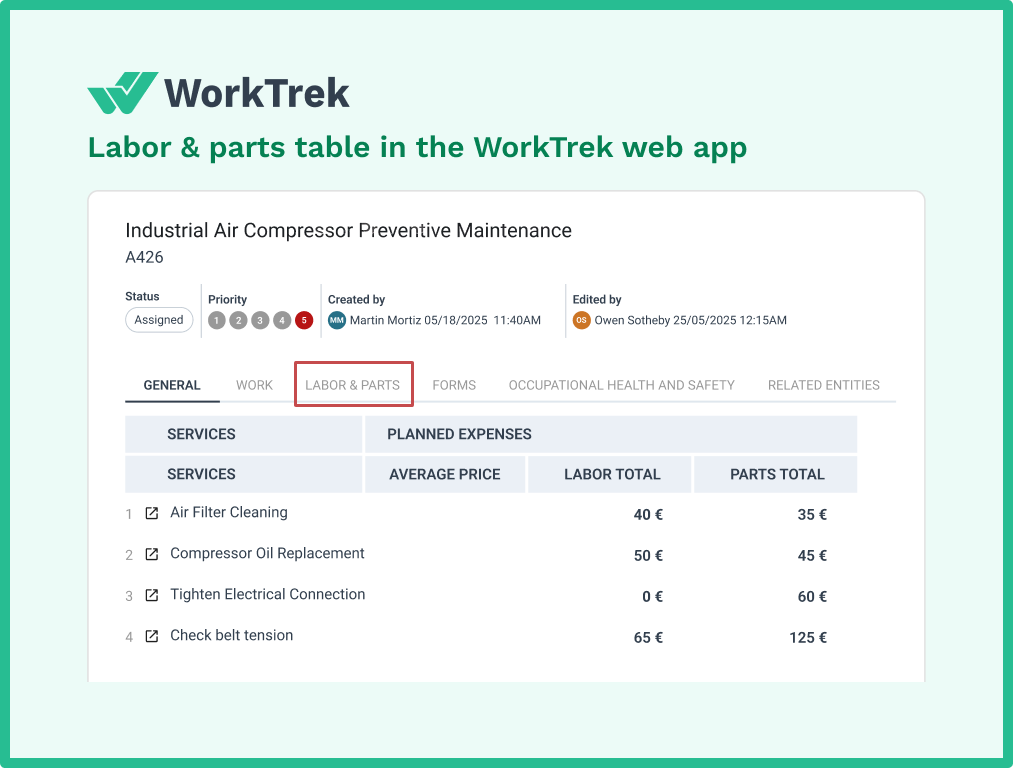
Data-Driven Decisions
The real power of WorkTrek comes from turning raw data into actionable insights.
For example, by analyzing planned versus actual maintenance costs across assets, you can identify equipment that consistently exceeds budget.
This is often a sign that replacement is more cost-effective than continued repairs.
This kind of analysis would take hours with spreadsheets. With WorkTrek, the data updates continuously, and the insights are available whenever you need them.
Best Practices for Improving Your Failure Metrics
Tracking metrics is only the first step. Here’s how to use your data to drive continuous improvement in your maintenance operations.
Shift to Proactive Maintenance
The single most effective way to improve nearly all failure metrics is to adopt a proactive maintenance approach.
Deloitte research shows that predictive maintenance can:
- Increase equipment uptime by 10-20%
- Reduce maintenance costs by 5-10%
- Reduce maintenance planning time by up to 50%
Proactive maintenance strategies include:
- Preventive maintenance – Time-based or usage-based maintenance performed before failures occur
- Predictive maintenance – Using sensors and data analysis to predict failures before they happen
- Condition-based maintenance – Performing maintenance only when sensor data indicates it’s needed
Each approach reduces equipment failures, improves MTBF, and decreases the time your team spends on reactive maintenance.
Standardize Repair Processes
Creating standard operating procedures (SOPs) for common repairs dramatically improves MTTR.
When technicians follow proven repair processes rather than troubleshooting from scratch each time, they complete work faster and more reliably.
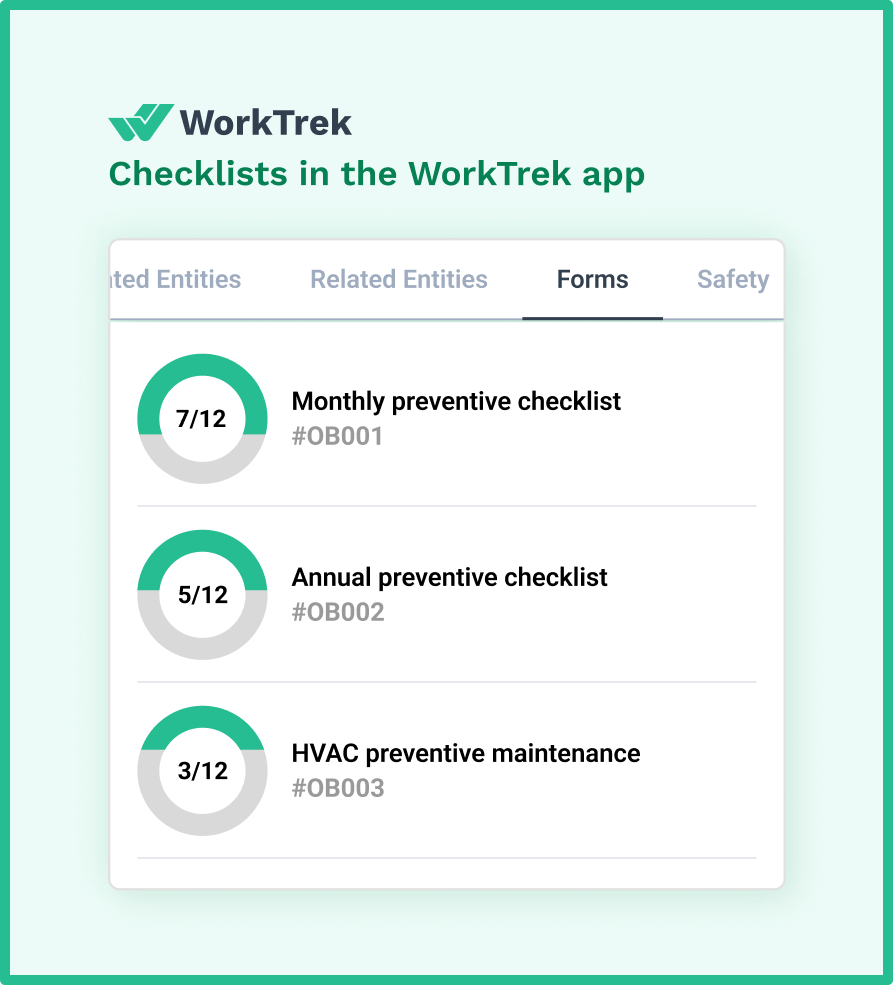
WorkTrek allows you to attach checklists and procedures directly to work orders, ensuring technicians have step-by-step guidance for every task.
Implement Root Cause Analysis
Don’t just fix failures—understand why they happen.
When the same asset fails repeatedly, conduct root cause analysis to identify the underlying problem. Common root causes include:
- Inadequate preventive maintenance
- Operator error
- Poor equipment design
- Environmental factors
- Substandard replacement parts
By addressing root causes, you reduce failure frequency, improve MTBF, and prevent recurring issues that consume maintenance resources.
Optimize Spare Parts Inventory
Parts availability directly impacts MTTR. If technicians must wait hours or days for critical components, repair time extends significantly.
However, stocking too many spare parts ties up capital unnecessarily.
Use failure data to optimize inventory. Items with short MTTF should be stocked in higher quantities. Critical assets should have key spare parts readily available to minimize downtime. Consider utilizing a CMMS software platform to streamline maintenance and asset management processes.
WorkTrek’s inventory management features track parts usage patterns and can alert you when stock levels fall below defined thresholds.
Invest in Training
Maintenance activities performed by well-trained technicians are completed faster and more effectively.
Regular training on:
- New equipment and technologies
- Troubleshooting techniques
- CMMS software usage
- Safety procedures
improves your team’s performance across all maintenance metrics.
Use Data to Drive Resource Allocation
Review your failure metrics regularly to identify patterns:
- Which assets have the lowest MTBF?
- Which equipment generates the most maintenance backlog?
- Where is MTTR highest?
Use this data to allocate resources strategically. Assets with poor reliability may need more frequent preventive maintenance, upgraded components, or replacement. High-MTTR assets may benefit from technician training or better parts availability.
Monitor Leading Indicators
While metrics like MTTR and MTBF are lagging indicators (they measure what already happened), leading indicators help you predict future performance.
Metrics like planned maintenance percentage and schedule compliance are leading indicators. Improving these metrics typically increases MTBF and reduces downtime.
Conclusion
Equipment failure metrics can transform maintenance from guesswork into a data-driven practice.
By tracking MTTR, MTBF, MTTF, OEE, planned maintenance percentage, maintenance backlog, and schedule compliance, you gain complete visibility into asset performance and maintenance effectiveness.
The data reveals exactly where to focus your improvement efforts, whether that’s reducing repair time, improving asset reliability, or shifting more resources to preventive maintenance.
Modern CMMS platforms like WorkTrek make data collection and metric tracking easier than ever. Instead of spending hours manually gathering information from spreadsheets and paper logs, automated systems deliver real-time insights that help you make better decisions faster.
The right metrics, combined with the right tools, give you the power to minimize downtime, reduce costs, and maximize the performance of every asset in your operation.