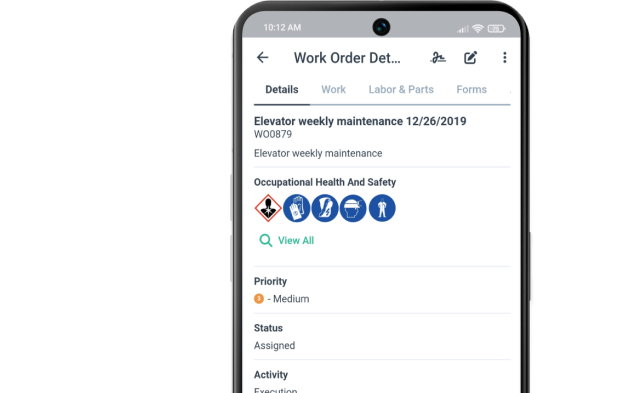
Get a Free WorkTrek Demo
Let's show you how WorkTrek can help you optimize your maintenance operation.
Try for freeMaintenance teams need clear metrics to reduce guesswork. Clear maintenance matrices can also reduce costly breakdowns and inefficient resource allocation.
When equipment fails, it can devastate production output and costs. It can also cause teams to scramble to fix problems that could have been prevented. The difference between reactive and planned maintenance often represents thousands—even millions—in operational losses.
One approach is to track seven essential maintenance Key Performance Indicators (KPIs), such as MTBF, MTTR, and Overall Equipment Effectiveness (OEE).
By utilizing measurable insights, maintenance teams can optimize operations and eliminate guesswork. This can lead to better maintenance performance and reduced maintenance costs, and most importantly, this approach can reduce equipment downtime.
Key Takeaways
- Organizations prevent equipment failures and reduce unplanned downtime by tracking key maintenance performance indicators (KPIs), such as Mean Time Between Failures (MTBF) and Mean Time To Repair (MTTR).
- Implementing a maintenance management software like WorkTrek CMMS can streamline tracking maintenance Key Performance Indicators
- Regular monitoring of maintenance metrics enables data-driven decisions that extend asset lifespans and improve reliability.
Defining KPIs for Maintenance Management
Maintenance KPIs are measurements that link organizational processes with specific maintenance goals. They help maintenance teams track progress and identify areas for improvement.
Good maintenance KPIs should be:
- Specific
- Measurable
- Achievable
- Relevant
- Rime-bound (SMART)
They provide clear insights into how well maintenance operations perform against established benchmarks.
KPIs are the nerve center that serves as a dashboard for maintenance managers to make informed decisions.
They are designed to transform raw data into actionable intelligence that drives maintenance strategy.
Key Categories of Maintenance KPIs:
- Equipment Performance
- Maintenance Efficiency
- Cost Management
- Safety Metrics
- Resource Utilization
The most effective maintenance departments focus on a balanced mix of reactive and planned maintenance.
This balance, which is often measured as a ratio, is a critical indicator of maintenance maturity.
Several essential maintenance KPIs include:
- Mean Time To Repair (MTTR)
- Mean Time Between Failures (MTBF)
- Overall Equipment Effectiveness (OEE)
By following these metrics, maintenance teams can better understand equipment reliability and maintenance response effectiveness.
All maintenance teams want to reduce maintenance costs. As a result, they should focus on KPIs that help them track maintenance expenses closely.
This metric helps organizations understand the financial impact of their maintenance programs.
Modern CMMS solutions enable teams to track these KPIs automatically. This technology removes the burden of manual data collection and provides real-time visibility into maintenance performance.
1. Reliability and Performance Metrics
Tracking reliability and performance metrics enables maintenance teams to assess equipment health and pinpoint areas for improvement. These metrics offer valuable insights into the performance of your assets and where maintenance efforts should be concentrated.
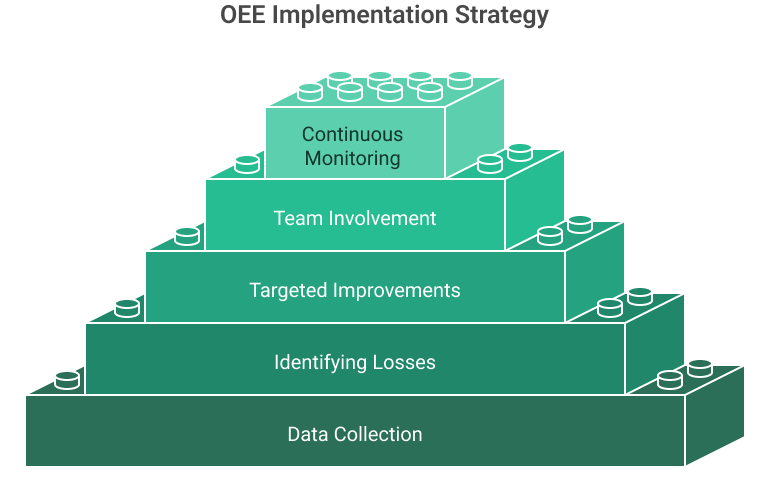
Overall Equipment Effectiveness (OEE)
OEE measures how effectively a manufacturing operation is utilized compared to its full potential.
OEE is considered the gold standard to track three critical factors:
- Availability,
- Performance
- Quality.
The formula for calculating OEE is:
OEE = Availability × Performance × Quality
OEE Calculator
OEE Calculator
How does OEE Work?
So, you might be asking how all this works. For a benchmark, an OEE score of 85% or higher is considered world-class.
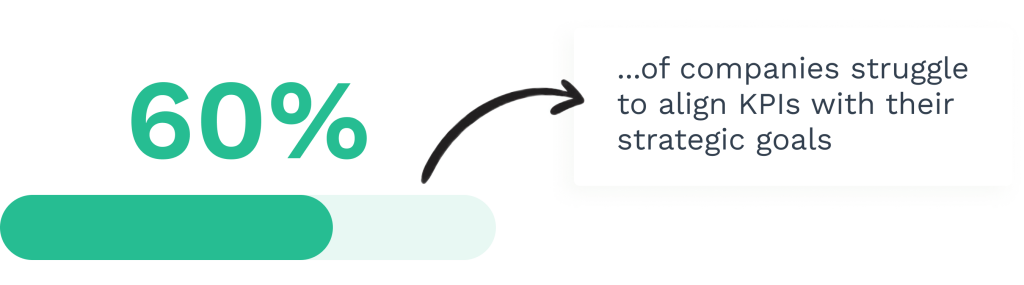
Based on our experience, most manufacturing facilities target an OEE of around 60%, which indicates significant room for improvement.
OEE helps maintenance teams identify specific areas causing equipment inefficiency. For example, low availability might indicate excessive downtime, while performance issues could point to speed losses.
Regular OEE tracking allows organizations to set benchmarks and measure the effectiveness of maintenance strategies over time.
Mean Time Between Failures (MTBF)
Another KPI is MTBF, which measures the average time between equipment failures. A higher MTBF value indicates better equipment reliability and more effective maintenance practices.
The calculation is straightforward:
MTBF = Total Operating Time ÷ Number of Failures
MTBF Calculator
MTBF Calculator
Calculate Mean Time Between Failures (MTBF) by entering your operational data below.
Results:
Tracking MTBF helps maintenance teams:
- Predict when equipment might fail
- Schedule preventive maintenance effectively
- Identify problematic assets that require attention
- Measure the success of reliability improvement initiatives
One good practice is to track MTBF against the manufacturer's benchmarks or historical data.
A declining MTBF can indicate deteriorating equipment condition, while an improving trend shows successful maintenance interventions.
Regularly analyzing MTBF data helps organizations move from reactive to proactive maintenance approaches.
2. Cost and Efficiency Tracking
Tracking maintenance costs and efficiency metrics provides insight into maintenance operations' financial performance and resource utilization.
Tracking maintenance costs closely can help teams better justify their budgets and identify areas for improvement.
Maintenance Costs as a Percentage of Asset Replacement Value
Every piece of equipment has a defined lifetime. At some point, maintenance managers have to decide whether the equipment is worth the cost of repairs.
So, how do you calculate this?
The formula is simple: divide total maintenance costs by the replacement value of all assets, then multiply by 100 to get a percentage.
Industry benchmarks for world-class facilities typically range from 2-3%. Higher percentages may indicate inefficient maintenance practices or aging equipment requiring more repairs.
This metric helps maintenance managers:
- Compare maintenance spending across different facilities
- Justify budget requests based on industry standards
- Identify when replacement might be more cost-effective than continued repairs
When this percentage consistently rises, it's time to investigate the root causes and potential solutions.
Planned Maintenance Percentage (PMP)
Planned Maintenance Percentage measures the ratio of scheduled maintenance work to total maintenance activities.
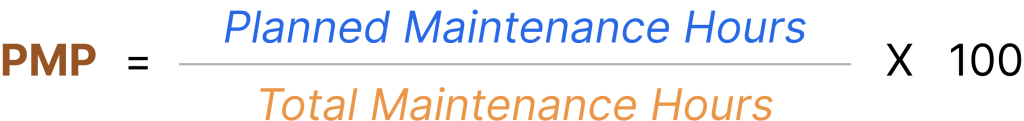
It can be calculated by dividing the planned maintenance hours by the total maintenance hours and then multiplying by 100.
Generally, a higher PMP indicates more proactive maintenance management.
The gold benchmark most industry leaders strive to follow is a PMP of 80-90%, indicating that most work is planned rather than reactive.
PMP Calculator
Planned Maintenance Percentage Calculator
Calculate your organization's Planned Maintenance Percentage (PMP) by entering the maintenance hours below.
Benefits of tracking PMP include:
- Reduced emergency repairs
- Better resource allocation
- Lower overall maintenance costs
- Extended asset lifespans
- Improved maintenance planning
- Increased asset performance
So, how do you improve your organization's PMP? One popular approach is to implement regular preventive maintenance schedules and gradually convert emergency repairs into planned activities.
Use work order data from your CMMS systems to identify recurring issues that can be addressed proactively.
Tracking this KPI over time helps maintenance teams shift from a reactive "firefighting" approach to a more strategic maintenance strategy.
3. Quality Assurance Metrics
Tracking quality metrics helps maintenance teams identify problems before they cause major breakdowns. These measurements emphasize repair efficiency and equipment reliability to ensure optimal operational performance.
Mean Time to Repair (MTTR)
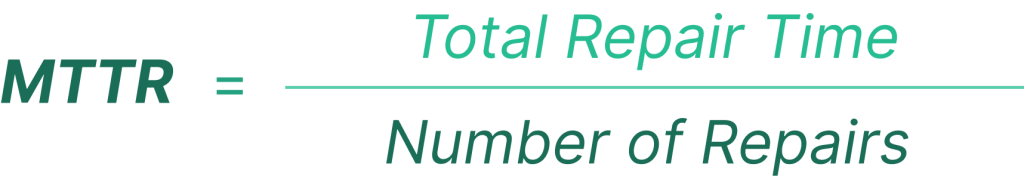
MTTR measures the average time required to fix equipment after a failure occurs. This essential maintenance KPI tracks the efficiency of your repair processes and technician performance.
A lower MTTR indicates that your maintenance team resolves issues quickly, minimizing production losses. To calculate MTTR, divide the total repair time by the number of repairs performed during a specific period.
Formula: MTTR = Total Repair Time ÷ Number of Repairs
MTTR Calculator
Mean Time To Repair (MTTR) measures the average time required to repair a failed system and return it to operational status. This includes:
- Detection time
- Diagnosis time
- Repair time
- Testing time
Results:
For example, if your team spent 40 hours on eight repairs last month, your MTTR would be 5 hours.
Factors affecting MTTR include:
- Technician skills and training
- Parts availability
- Repair procedure quality
- Diagnostic tool effectiveness
By setting MTTR benchmarks, maintenance managers can improve process inefficiencies.
Many organizations aim to reduce MTTR by 5-10% annually through better training and improved spare parts management.
Equipment Downtime Analysis
Equipment downtime analysis examines periods when machinery isn't operational due to failures or maintenance. This metric directly impacts overall equipment effectiveness (OEE) and production capacity.
Tracking downtime by equipment type, cause, and duration helps identify chronic problems. Maintenance teams should categorize downtime as either:
- Planned downtime: Scheduled maintenance activities
- Unplanned downtime: Unexpected breakdowns requiring immediate attention
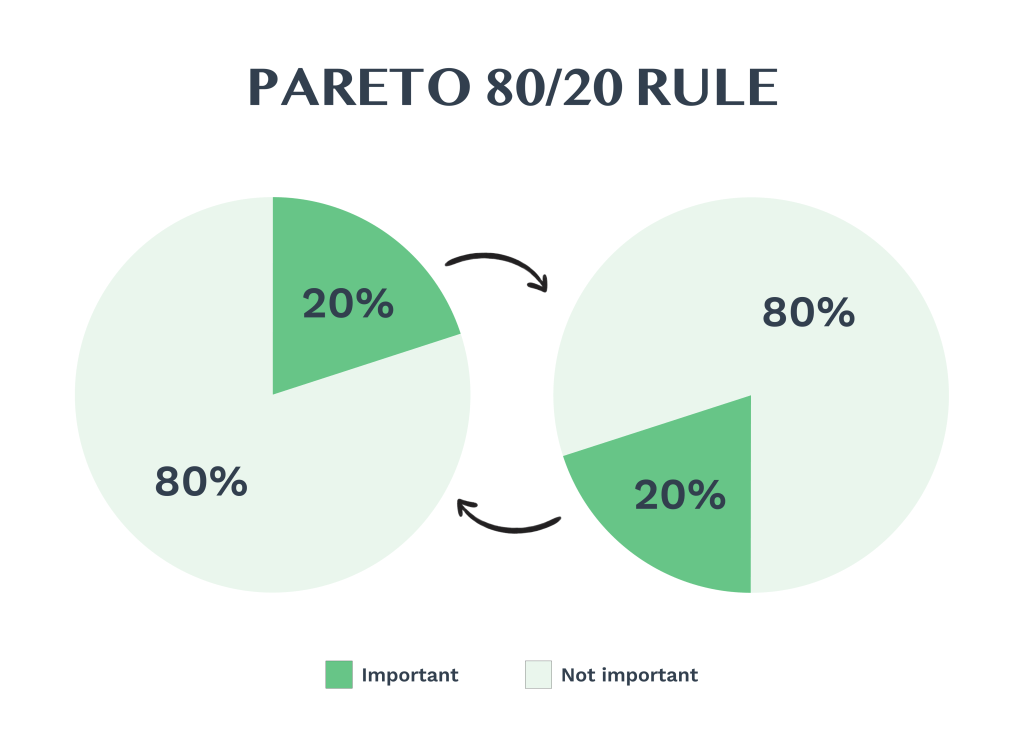
It is important to keep track of the ratios between these types. Top-performing maintenance departments maintain an 80:20 ratio of planned to unplanned downtime.
Additionally, creating a downtime Pareto chart helps identify the "vital few" issues causing most problems. For instance, a food processing plant might discover that 80% of its downtime stems from just 20% of equipment failures.
Regular equipment downtime review meetings help maintenance teams track improvement initiatives, improve maintenance metrics, reduce maintenance backlogs, and justify investments in preventive maintenance programs.
4. Safety and Compliance Indicators
Every maintenance manager strives to create a safe work environment. Tracking safety and compliance metrics and maintenance performance metrics helps maintenance teams prevent accidents and ensure regulatory adherence.
These indicators protect workers and minimize legal risks and financial penalties.
Safety Incident Rate
The Safety Incidents Rate measures the frequency of workplace accidents related to maintenance activities.
This KPI is typically calculated as the number of incidents per a set number of work hours (often per 200,000 hours worked).
A declining Safety Incident Rate indicates improving workplace safety conditions. To effectively track this metric, maintenance managers should:
- Document all incidents, including near-misses
- Categorize incidents by severity and type
- Analyze the root causes of each incident
- Track incident trends over time
Many organizations set target thresholds for this KPI, such as fewer than three incidents per 200,000 work hours.
Regular safety audits and proactive maintenance can help reduce this rate.
The best maintenance teams utilize this metric to identify hazardous equipment, high-risk procedures, or areas requiring additional safety training.
Regulatory Compliance Rate
All maintenance organizations must comply with regulatory requirements, from OSHA to EPA rules. The Regulatory Compliance Rate measures how well maintenance activities meet industry regulations and standards.
This metric is calculated as the percentage of compliance requirements satisfied during audits or inspections.
Maintaining high compliance rates helps organizations avoid:
- Government fines and penalties
- Equipment shutdowns
- Production delays
- Reputational damage
Compliance requirements vary by industry but often include equipment certification, maintenance documentation, and adherence to safety protocols. For example, facilities with pressure vessels must follow specific maintenance schedules to remain compliant.
Regular internal audits can help identify compliance gaps before they become issues during official inspections. Maintenance teams should use digital systems to track regulatory deadlines and certification expiration dates.
5. Inventory and Procurement Management
Effective maintenance relies on having the right parts and supplies when needed. Tracking inventory metrics helps prevent costly downtime while procurement KPIs ensure reliable supplier relationships.
Stock Out Rate
Stock out rate measures how often maintenance teams cannot find necessary parts when needed. This key performance indicator (KPI) has a direct impact on downtime and repair delays.

The formula for calculating stock out rate is:
Stock Out Rate = (Number of Stock Outs / Total Number of Parts Requests) × 100%
A high stock-out rate indicates potential problems in inventory management. Maintenance managers should aim for a rate below 2-3%.
To improve this metric, teams should:
- Implement minimum stock level alerts
- Use inventory management software
- Analyze usage patterns for critical parts
- Develop emergency procurement procedures
Reviewing stock-out incidents helps identify which critical parts require higher safety stock levels. Implementing a CMMS software like WorkTrek can help you set automatic stock-out alerts.
Supplier Performance Score
This metric assesses how effectively vendors meet the needs of the maintenance department. A comprehensive supplier score typically includes delivery time, quality, and cost factors.
Key components to track include:
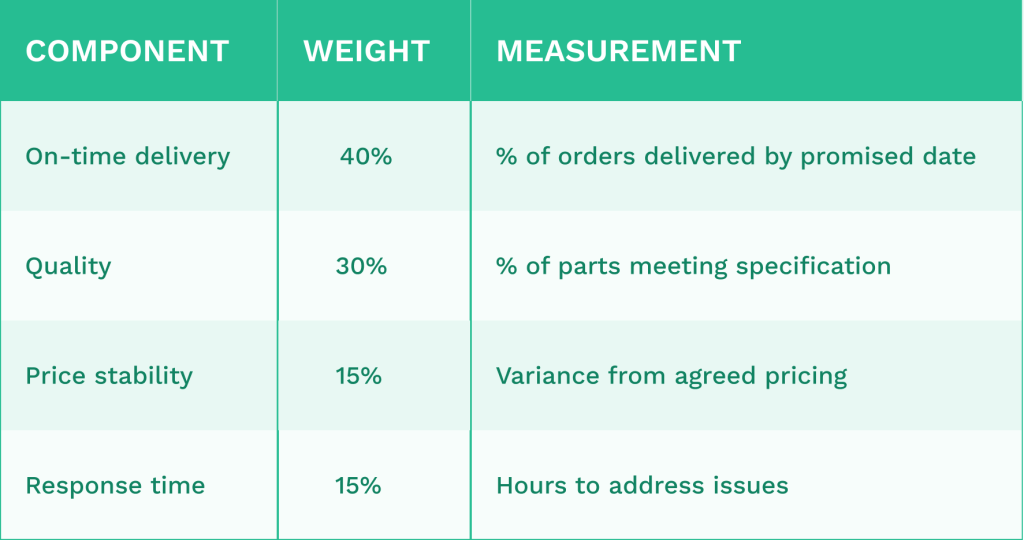
Supplier lead time is particularly critical for maintenance operations. Tracking average delivery times helps maintenance planners schedule work more effectively.
Teams should review supplier scores quarterly and use the data for vendor negotiations. Poor-performing suppliers should receive improvement plans or be replaced with more reliable alternatives.
6. Work Order and Workflow Statistics
Tracking work order metrics provides critical insights into maintenance efficiency and team performance. These statistics help identify bottlenecks, optimize resource allocation, and ensure timely completion of maintenance tasks.
Work Order Backlog
The work order backlog refers to the number of pending maintenance tasks that have yet to be completed. This metric is typically measured in hours or days of work.
A growing backlog indicates that your team cannot meet maintenance demands, which requires an adjustment.
Estimated maintenance backlog hours should be monitored weekly to ensure proper resource planning. Maintenance managers should aim to manage the backlog, typically 2-4 weeks of work.
Excessive backlogs can lead to:
- Increased equipment downtime
- Higher risk of emergency breakdowns
- Maintenance staff burnout
- Cascading failures across systems
- Maintenance overtime hours
- Reduced asset reliability
Breaking down the backlog by priority levels, equipment type, and department helps identify problem areas that need immediate attention.
Response Time and Completion Rates
Average response time measures how quickly maintenance teams address work requests. This KPI directly impacts equipment downtime and user satisfaction.
Response times should be categorized by priority:
- Emergency: 1-2 hours
- Urgent: 24 hours
- Normal: 48-72 hours
- Low priority: 1-2 weeks
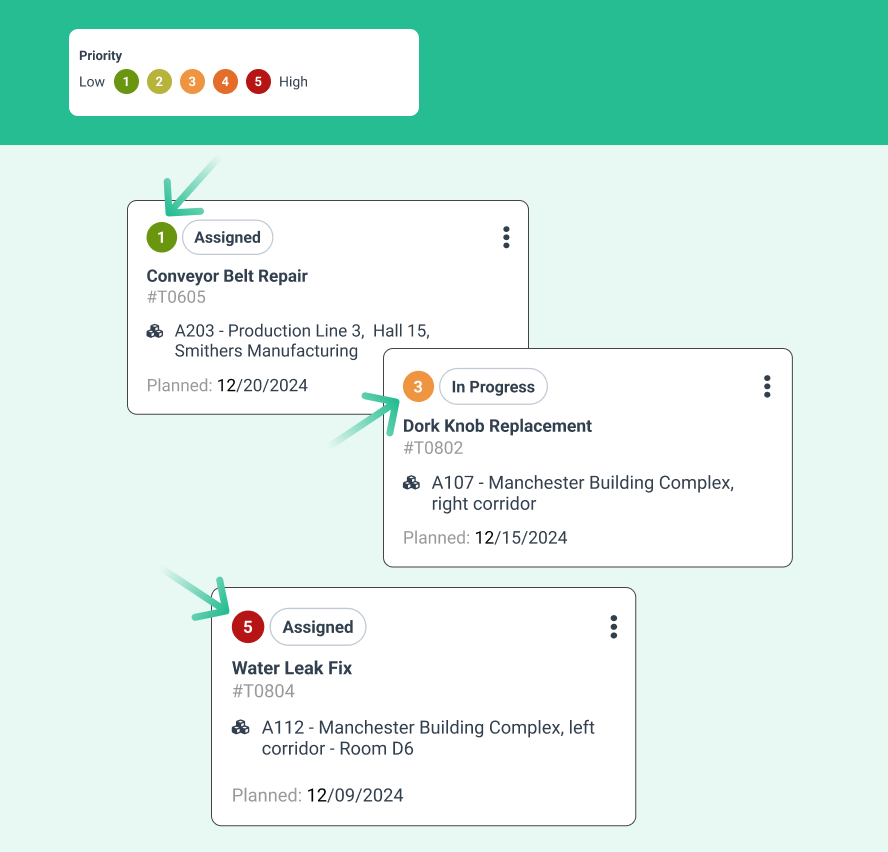
Completion rates track the percentage of work orders finished within target timeframes. On-time work order performance should aim for 90%+ compliance with established deadlines.
Analyzing these metrics helps identify training needs, resource shortages, or procedural bottlenecks. Teams can use this data to implement targeted improvements and standardize organizational workflow processes.
7. Continuous Improvement and Predictive Analytics
Modern maintenance is evolving beyond reactive approaches through the use of data analysis and forward-thinking methodologies. These strategies enable maintenance teams to prevent failures before they occur and continually refine their practices.
Trending Failure Analysis
Trending Failure Analysis examines patterns in equipment breakdowns to identify underlying causes. This approach utilizes historical data trends to identify recurring issues and implement lasting solutions.
Teams should track:
- Failure frequency by equipment type
- Common failure modes
- Environmental factors contributing to failures
- Seasonal patterns in breakdowns
When properly implemented, this analysis reduces repeat failures by 30-40%. Organizations using trending analysis report significant decreases in unplanned downtime.
A well-structured failure analysis program requires the right tools and proper staff training. Many CMMS systems, such as WorkTrek, now include built-in analysis capabilities to simplify this process.
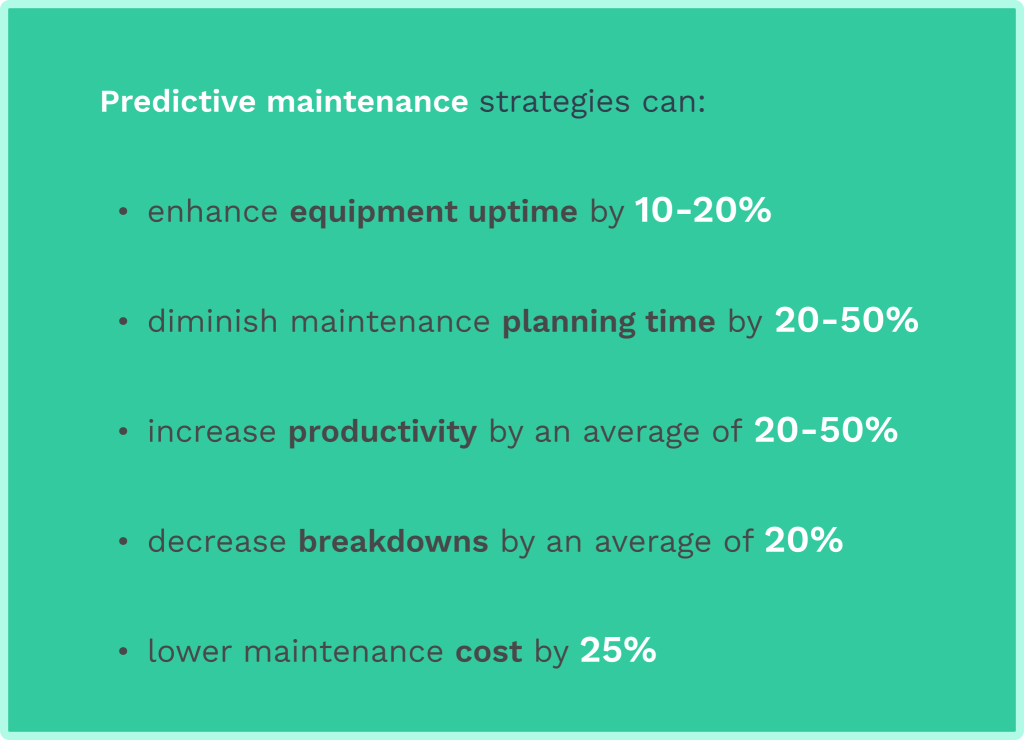
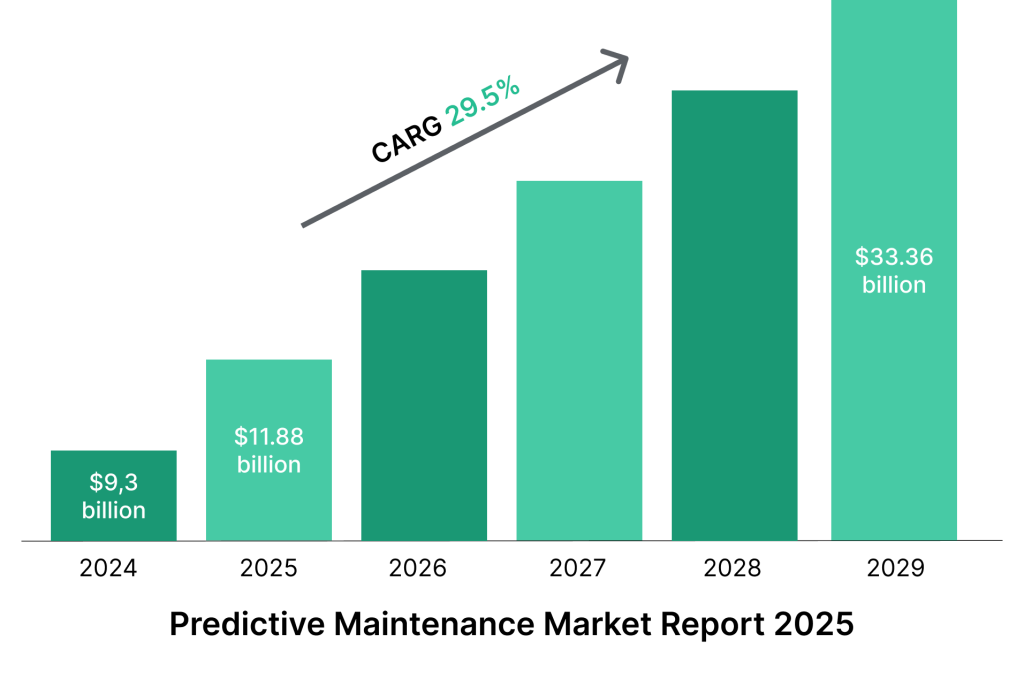
Predictive Maintenance Adoption Rate
This KPI measures how quickly and thoroughly an organization implements predictive maintenance technologies.
It tracks progress from traditional maintenance methods to data-driven, forward-looking approaches.
Organizations typically measure this rate by:
- Percentage of assets monitored by predictive technologies
- Staff trained in predictive methods
- Budget allocated to predictive maintenance tools
- Reduction in reactive maintenance work orders
Facility management leaders find this KPI essential for tracking technological progress. Companies with high adoption rates (over 60%) typically experience a decrease in maintenance costs of 15-25%.
Successful adoption depends on choosing the right starting points. Begin with critical equipment where failures cause significant disruption, then expand gradually based on proven results.
Leveraging CMMS for KPI Tracking and Optimization
Modern Computerized Maintenance Management Systems (CMMS) have revolutionized how maintenance teams collect, analyze, and act upon performance data.
CMMS software provides the infrastructure to transform raw maintenance data into actionable insights through automated KPI tracking.
Real-Time Dashboard Visibility
A robust CMMS creates centralized dashboards that allow maintenance managers to simultaneously monitor all seven essential KPIs.
This real-time visibility eliminates the guesswork from maintenance management by providing:
- Customizable KPI displays that highlight critical metrics
- Automated data collection that reduces manual input errors
- Visual indicators that quickly flag metrics falling outside acceptable ranges
- Historical trending data to identify long-term performance patterns
By consolidating these metrics into accessible dashboards, maintenance teams can spot potential issues before they escalate into costly breakdowns or production delays.
Automated Data Collection and Analysis
Manual data collection introduces delays and inaccuracies that compromise KPI effectiveness. Modern CMMS platforms address this challenge through:
- Integration with equipment sensors and IoT devices for automatic data capture
- Standardized work order templates that ensure consistent data entry
- Built-in calculation engines that process complex metrics like OEE and MTBF
- Automated report generation based on predefined thresholds
This automation eliminates the administrative burden of KPI tracking, allowing maintenance teams to focus on analysis and improvement rather than data gathering.
Predictive Maintenance Capabilities
The most advanced CMMS solutions have evolved beyond simple tracking to incorporate predictive capabilities that transform reactive maintenance cultures into proactive ones. These systems:
- Analyze historical failure data to identify patterns and warning signs
- Create alerts when equipment performance metrics indicate potential failures
- Generate preventive maintenance schedules based on actual usage patterns
- Calculate optimal parts inventory levels based on equipment reliability data
Through these predictive features, maintenance teams can address equipment issues before failures occur, significantly reducing downtime and extending asset lifespans.
Enhanced Resource Allocation
Effective resource management is critical for maintenance efficiency, and CMMS platforms provide the insights needed to optimize staff and inventory allocation:
- Work order prioritization based on equipment criticality and failure risk
- Technician assignments matched to skill requirements and availability
- Parts inventory management aligned with maintenance schedules
- Budget allocation guided by maintenance cost analysis
These capabilities ensure that limited maintenance resources deliver maximum impact on overall equipment reliability and operational efficiency.
Continuous Improvement Support
Perhaps most importantly, CMMS systems provide the foundation for continuous improvement by:
- Establishing baseline performance metrics for all critical assets
- Identifying root causes through detailed failure analysis tools
- Tracking the effectiveness of corrective actions through before-and-after comparisons
- Benchmarking performance against industry standards or internal targets
This data-driven approach to improvement enables maintenance teams to eliminate recurring issues systematically and steadily increase equipment reliability over time.
Implementation Considerations
While CMMS offers powerful benefits for KPI tracking, successful implementation requires careful planning:
- Start with a focused set of KPIs that align with organizational priorities
- Ensure proper configuration of calculation methods to maintain data integrity
- Provide adequate training for maintenance staff to encourage system adoption
- Establish regular review processes to translate data insights into action plans
Organizations that follow these implementation best practices typically see a 10-15% reduction in maintenance costs and a 20-30% increase in planned maintenance activities within the first year of CMMS adoption.
By leveraging CMMS technology for KPI tracking, maintenance teams can transform from reactive repair crews into strategic asset managers, driving significant improvements in equipment reliability, operational efficiency, and overall maintenance performance.
Summary
The journey from reactive to proactive maintenance begins with measuring what matters. Maintenance teams transform from cost centers into strategic business partners by implementing and regularly tracking the seven essential KPIs outlined in this article—from reliability metrics like MTBF and OEE to workflow statistics and predictive indicators.
These metrics provide the foundation for informed decision-making, allowing teams to prevent failures before they occur, optimize resource allocation, and demonstrate clear ROI on maintenance investments.
Modern CMMS solutions like WorkTrek have made this data-driven approach accessible to organizations of all sizes by automating data collection, providing real-time visibility, and enabling predictive maintenance capabilities.
The most successful maintenance departments leverage these tools not just for tracking, but as platforms for continuous improvement, systematically eliminating recurring issues and steadily increasing equipment reliability.
Remember that effective KPI implementation isn't about collecting data for its own sake—it's about creating actionable insights that drive tangible improvements in equipment reliability, operational efficiency, and bottom-line results.
By establishing clear metrics, leveraging the right technology, and committing to data-driven decision-making, maintenance teams can deliver significant and sustainable value to their organizations.