

Get a Free WorkTrek Demo
Let's show you how WorkTrek can help you optimize your maintenance operation.
Try for freeKey Takeaways:
- 72% of manufacturing leaders say undocumented workarounds hide their true downtime.
- A CMMS like WorkTrek lets the team record downtime on the work order for accuracy.
- Automated tracking captures short stops that manual logs can miss, while reason codes explain the losses.
- Various factors determine how that same downtime data can lead to different availability figures.
Machine downtime tracking records when a machine stops, how long the stop lasts, and its recorded reason. Maintenance teams usually do it in one of three ways – a manual log, work orders in a CMMS such as WorkTrek, or automated tracking with sensors and machine signals.
Each method catches a different share of stops, which affects every number you calculate later.
Below, you’ll find how each method works, why standardization of data matters, and a selection of metrics to track.
Machine Downtime Tracking Methods
Generally, the three methods of equipment downtime tracking differ in who or what records the stop and how many stops they catch.
These methods can be combined. When the Manufacturing Leadership Council asked manufacturers in 2025 where their manufacturing data comes from, 86% named shop floor systems such as PLCs, 79% named manually entered data, and 67% named equipment maintenance systems. The survey covered production data sources in general, rather than downtime tracking specifically.
Here’s a quick overview of each method to guide your initial decision-making:
| Method | Who or what records the stop | Short stops captured? | Timestamp accuracy | How reason codes are entered | Setup effort | Best fit |
|---|---|---|---|---|---|---|
| Manual log (paper or Excel) | Operator or supervisor | Rarely | Estimated, often written up at shift end | Written in or picked from a dropdown | Low | Small plants, a few machines, teams starting out |
| CMMS work orders | Technician or requester | Only if logged or imported through an integration | Depends on when the technician records start and end | Failure code on the work order | Medium | Plants where breakdowns cause most losses, any machine mix |
| Automated tracking | Current sensor, PLC, or machine controller | Yes, down to seconds | Automatically recorded; depends on signal quality and configuration | Automatically from machine signals where supported; operators add missing context | High | High-volume lines, constraint machines, many short stops |
For figures on what these stops cost, see our roundup of unplanned downtime statistics.
Manual Machine Downtime Log
A manual log is a reasonable place to start when you run a few machines in a relatively small operation.
Paper works for a short pilot and costs virtually nothing. For anything longer, a machine downtime tracker in Excel lets you total and sort the data, as long as you set a few ground rules:
- One row per stop, even when two stops share a cause.
- Duration as a formula: enter start and end as full date-times, then (End – Start) × 1440 gives minutes.
- Reasons from a dropdown built with Data Validation, so “jam” and “jammed” don’t become two reasons.
You’ll find the fields to include in the How to Standardize Downtime Data section below.
The weak point of a manual log is human error and the risk that operators won’t do their due diligence. They typically focus on restarting the machine rather than recording detailed circumstances around short stops. As a result, timestamps are often recorded only when the operator is close to clocking out, so the records often become estimates.
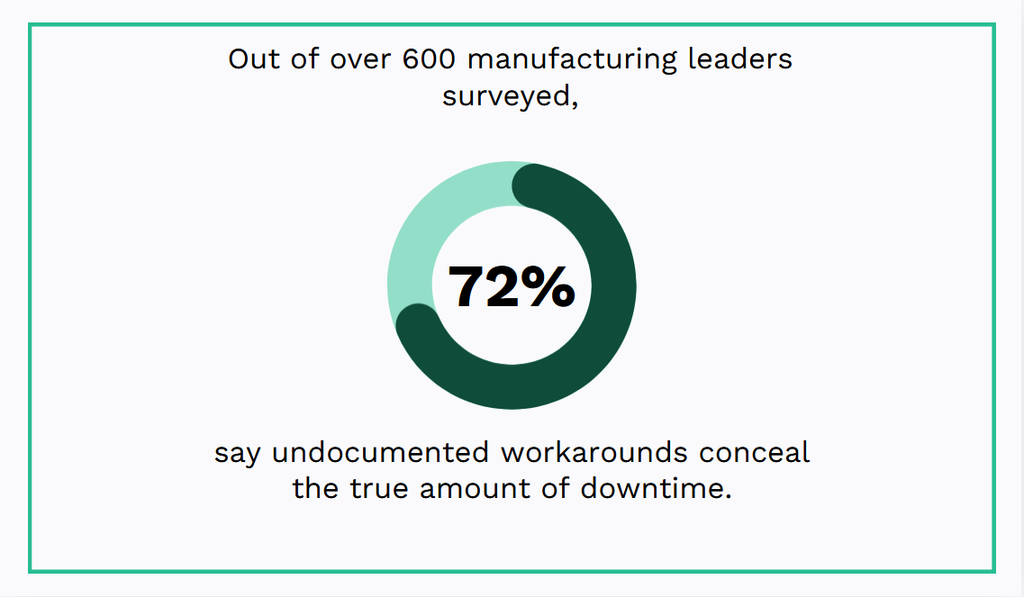
That is, if they even are recorded in the first place – in L2L’s 2025 survey of more than 600 US manufacturing leaders, 72% said undocumented workarounds conceal the true amount of downtime.
Of course, manual records do have their limits. Here are typical signs it’s time to move on to a more robust solution:
- Most stops end up under “other” or “unknown.”
- Logged downtime doesn’t explain lost output during a shift.
- You can’t tell which repair followed which stop.
CMMS Work Orders
Recording downtime in a CMMS ties each stop to the asset, the work order, the parts used, and the repair history. Immediately, you gain significantly more insight into the context of each stop.
What’s not to be discounted is the convenience that comes with digitalization and mobile apps. In Plant Engineering’s 2026 State of Manufacturing Operations and Maintenance study, 49% of respondents named mobile maintenance tracking apps as a critical emerging technology.
When downtime is recorded only through maintenance requests and work orders, stops that never generate either record can be missed. This can include short jams, changeovers, and waits for material.
Furthermore, the data itself will also only be as reliable as the work order. Inaccurate times, vague failure codes, or rushed notes all end up in the software. And that same data later feeds your reports, your MTTR, and your preventive maintenance decisions.
As Ricky Smith, CMRP, VP of World Class Maintenance, warns:

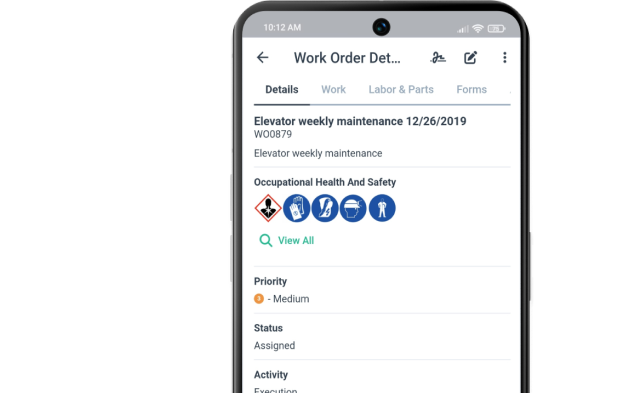
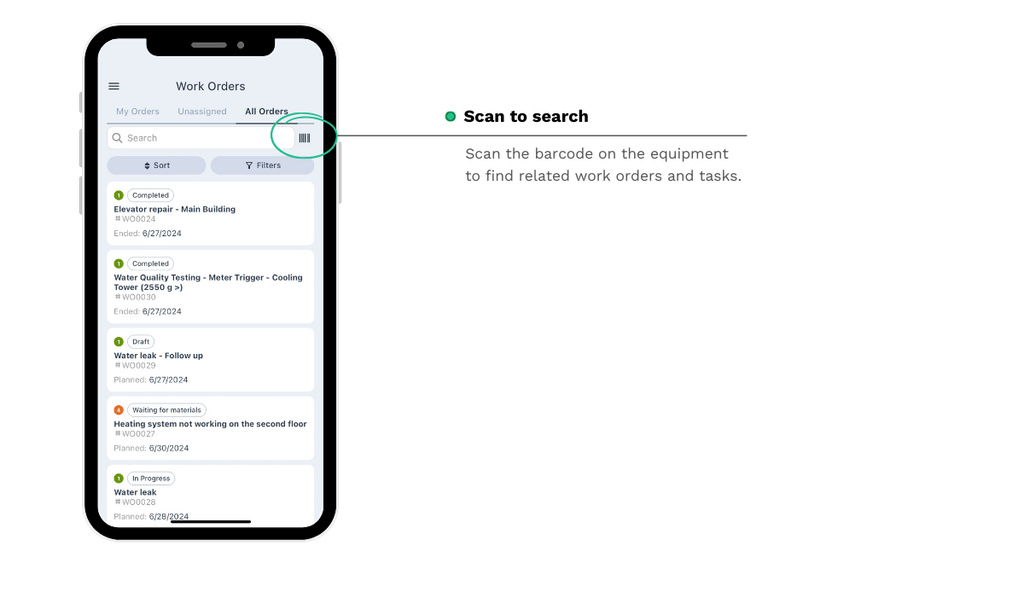
That’s why, with WorkTrek, we deliberately put downtime recording where the repair is already documented, so technicians log the stop while the details are fresh. Since mid-2026, technicians can record equipment downtime on work orders and requests directly in the WorkTrek mobile app.
Whoever takes the job then opens the work order on their phone, works through the checklist, logs labor and parts, attaches photos, and records the downtime.
Nobody copies times from a sheet into a system later. The downtime sits on the same work order as the labor, parts, and photos.
A detailed history for each asset and part pays off during a monthly review. The worst performers will clearly show up at the top of the list once you rank assets by downtime hours and number of stops.
From there, you can run a root cause analysis and reassess whether the system or machine requires a tighter preventive maintenance schedule. This also helps reduce downtime, as accurate records show you when to order spare parts ahead of time and replace them before they wear out completely.
They also show when a long repair wasn’t the technician’s fault, but the result of waiting for a part that wasn’t on the shelf.
Our guide on how to reduce downtime with CMMS covers the preventive side, if you’re interested in further reading.
Automated Downtime Tracking
Automated downtime tracking detects stops from the machine itself, whether or not anyone notices them.
The signal usually comes from one of three places:
- A current sensor clamped on the power cable, which shows whether the machine is running, idling, or off. It works on older machines without modern controls.
- The PLC, through a cycle-complete or fault signal.
- The machine controller, which on CNC machines can report its own status and alarms.
Some systems assign downtime reasons automatically from alarms and machine-state data. Operators add or confirm reasons when those signals do not explain the stop.
In fact, it’s reason codes that often determine whether an automated tracking setup succeeds or fails.
Pindel Global Precision, a machining company in Wisconsin, learned this firsthand. It installed a machine monitoring system years ago, but nobody was in charge of it, machinists rarely entered why their machines stopped, and the system was eventually left unused.
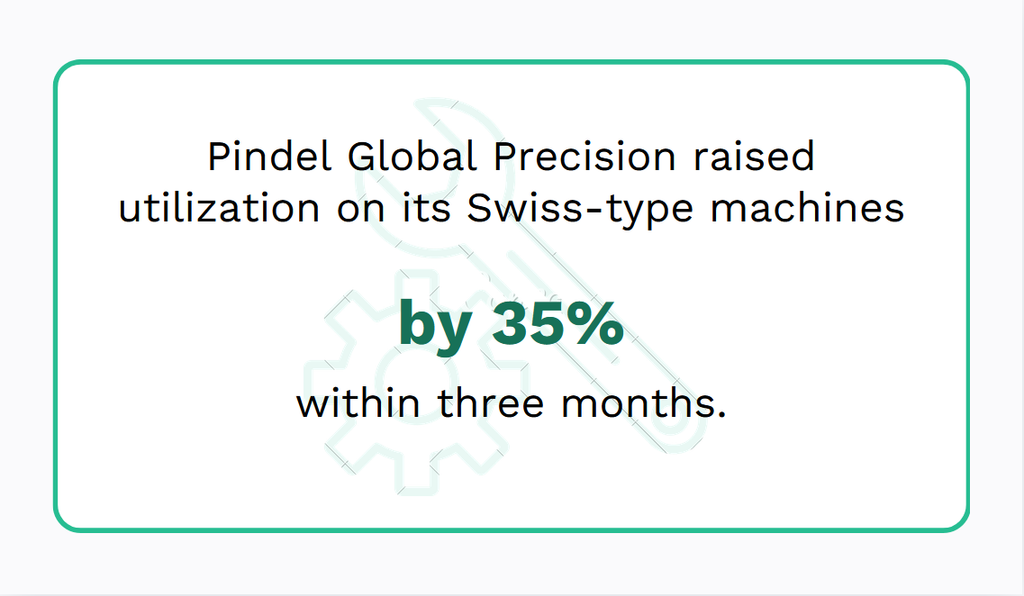
In 2024, the company hired a director of training and continuous improvement to get it running again. He put tablets back on every machine and made logging downtime causes part of the machinists’ routine. According to Modern Machine Shop, utilization on Pindel’s Swiss-type machines went up 35% within three months.
To set automated tracking up, start with your designated bottleneck, i.e., the machine that limits your line’s output. Every minute it’s down is a minute of output lost for the whole line, so that’s where the data matters most.
The sensors also need a network connection, usually Wi-Fi, Ethernet, or a cellular gateway. Bring IT in early, since they’ll want to review anything connected to production equipment.
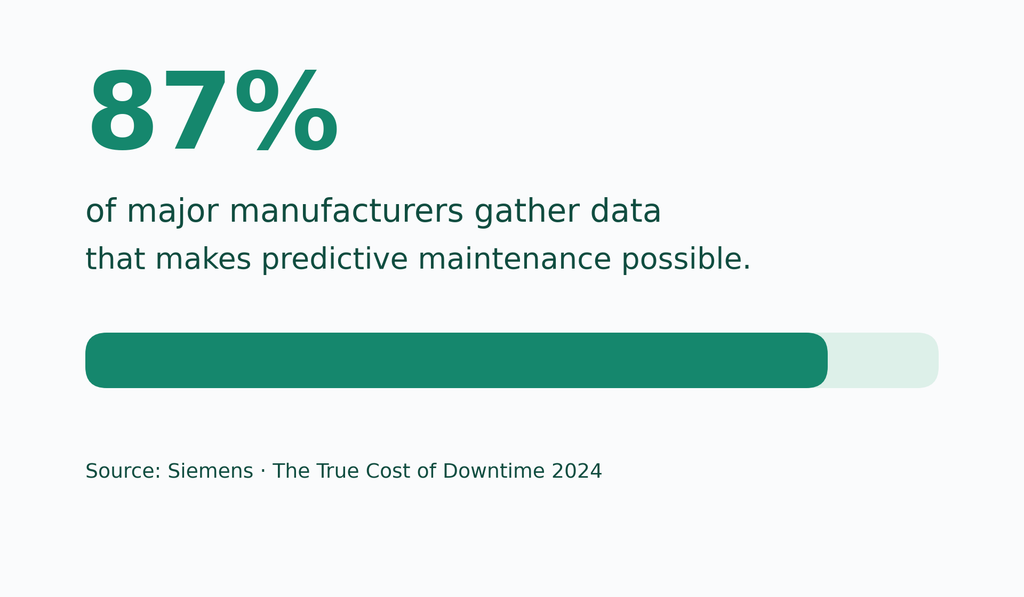
Large plants often have the groundwork in place. Siemens’ True Cost of Downtime 2024 report found that 87% of major manufacturers gather data that makes predictive maintenance possible.
But, crucially – don’t forget that automated tracking has blind spots, too.
Manual workstations give the system no signal to read. And a machine waiting for parts, or blocked by a full conveyor, shows up as down even though the problem is elsewhere on the line.
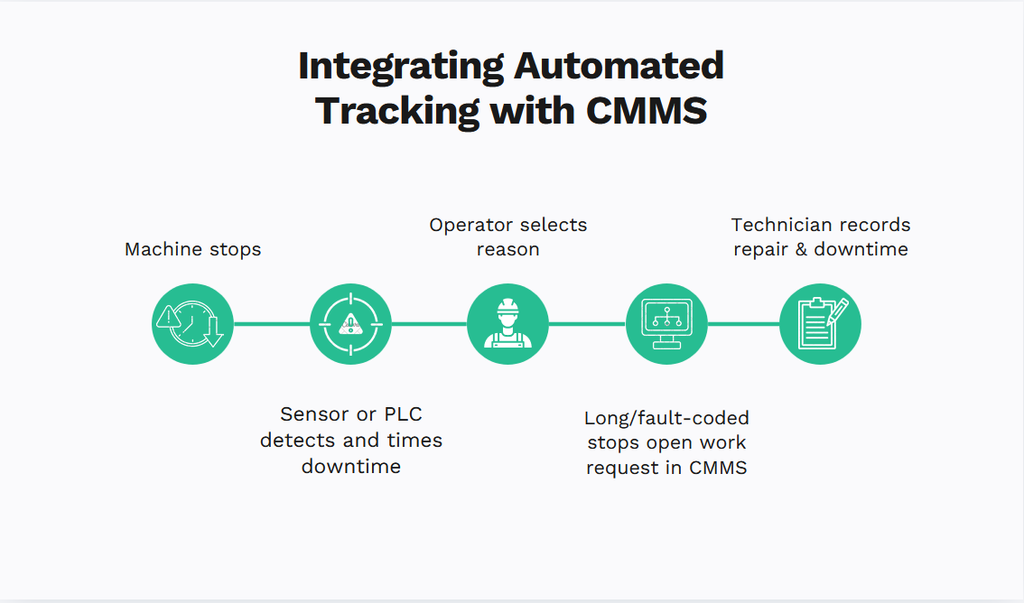
That’s where a CMMS helps. Monitoring records detected stops, and the CMMS handles maintenance work. With a supported integration configured, selected downtime events can trigger a maintenance request automatically. The diagram below shows one example workflow; the trigger rules depend on the setup.
However you connect the two, the numbers are only usable if your team records every stop the same way. That starts with standardizing the data.
How to Standardize Downtime Data
Standardizing starts with deciding what to record for every stop, and keeping that list short.
When a machine goes down, the operator’s priority is getting it running again, not filling in a form. The longer the form, the more fields get skipped or guessed, and the less you can trust what’s in it.
Here’s a list you can copy straight into your Excel downtime log:
| Field | What to enter | Example |
|---|---|---|
| Date and shift | Date of the stop and the shift it started in | 2026-11-03, Shift B |
| Machine or asset ID | The ID from your asset list or CMMS, not a nickname | CNC-07 |
| Start time | Date and time the machine stopped | 2026-11-03 14:12 |
| End time | Date and time it was running again | 2026-11-03 14:47 |
| Duration | Calculated from start and end, in minutes | 35 |
| Planned or unplanned | One of the two values | Unplanned |
| Reason category | Top-level group from your reason list | Mechanical |
| Specific reason | Second-level reason under that category | Spindle overload alarm |
| Action taken or work order number | What fixed it, or the work order that holds the repair | WO-10482, replaced coolant pump |
| Recorded by | Name or ID of the person logging the stop | J. Novak, operator |
Next, keep planned and unplanned downtime apart from day one, since most metrics count them differently.
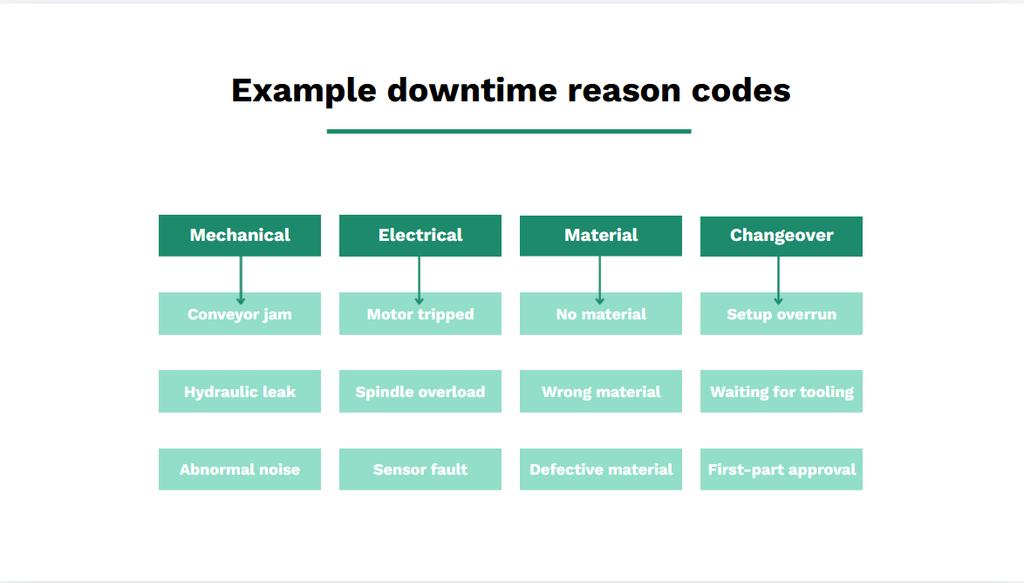
Reason codes need the same care. If operators can’t find the right one quickly, they’ll pick “other,” so keep the list short enough to fit on one screen.
The easiest way to build it is to let operators write reasons in their own words for a few weeks. Then group what they wrote into a few broad categories, each with specific reasons underneath.
Keep the reasons to what the operator can see. A conveyor jam is easy to confirm on the spot, while a worn bearing is a technician’s call.
If “other” appears frequently, review those entries to check whether a code is missing, existing labels are unclear, or operators need guidance.
Still, a category on its own won’t tell you much. As IDCON points out, downtime reports often blame hours of lost production on “electrical problems” without anyone finding out why the motor tripped. That’s why each stop needs a specific reason and the action taken, not only a category.
Before anyone logs a stop, your team also needs to agree on what counts as a downtime event. A few questions to settle:
- How short is too short? Pick a minimum length for stops logged by hand. Anything shorter is better left to automated tracking.
- Are changeovers planned downtime? IDCON, for one, counts setup time for a product change as scheduled downtime.
- What if a planned stop runs long? Logging the overrun as unplanned keeps it from disappearing into the schedule.
- Where do starved or blocked machines go? Decide whether the stop is logged against the idle machine or the one that caused it.
- When does a stop end? When the repair is done, or when the machine is making good parts again?
Write the answers on one page and keep it next to the log, so every shift follows the same rules.
Machine Downtime Metrics to Track
Downtime data turns useful once you calculate a few standard metrics from it.
| Metric | What it measures | Formula | What it tells the maintenance team |
|---|---|---|---|
| Total downtime | All time the machine was stopped in a period | Sum of all stop durations | How much capacity the machine lost |
| Downtime frequency | How often the machine stops | Number of stops in the period | Whether you’re dealing with many short stops or a few long ones |
| Availability | Share of planned production time the machine was running | Run time ÷ planned production time × 100 | How much of the schedule the machine delivered |
| MTBF | Average running time between failures | Operating time ÷ number of failures | How reliable the machine is |
| MTTR | Average time spent repairing equipment after a failure | Total repair time ÷ number of repairs | How long repairs take, excluding waiting time |
| Downtime by reason | Downtime per reason code, ranked | Sum of durations per reason | Which problems to fix first |
| Unplanned downtime share | Share of downtime that wasn’t scheduled | Unplanned downtime ÷ total downtime × 100 | How much downtime was unscheduled |
No single metric tells the whole story, so read them together.
Asset availability and MTTR are good places to start, and our guide to MTBF covers the third reliability number.
Consider a machine over a 400-hour monthly reporting window. It has 20 hours of planned downtime excluded from the production schedule and 10 unplanned stops totaling another 20 hours: seven conveyor jams (5 hours) and three breakdowns (15 hours). It therefore runs for 360 hours. For this example, only the three breakdowns count as equipment failures. Of their 15 downtime hours, assume 6 were spent waiting for parts and 9 on repairs. The figures below use these illustrative assumptions:
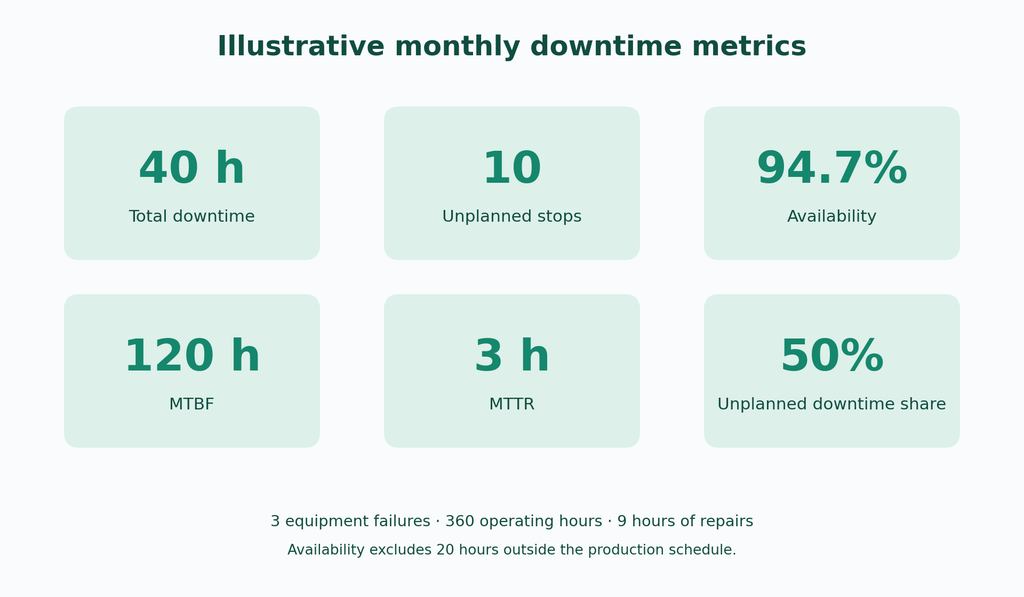
Notice that conveyor jams stopped the machine most often, but the three breakdowns cost the most hours.
Keep in mind that small differences in how you define each metric can shift the results. For instance:
- Availability. If the 20 planned hours were excluded from the production schedule, availability is 360 ÷ 380 × 100 = 94.7%. If production was scheduled throughout all 400 hours, availability is 360 ÷ 400 × 100 = 90%.
- MTTR. Mean time to repair is 9 ÷ 3 = 3 hours. Average elapsed downtime per breakdown, including the wait for parts, is 15 ÷ 3 = 5 hours. MTBF is 360 ÷ 3 = 120 operating hours per failure.
These figures use different time bases and definitions, so label them clearly and use the same definitions when comparing machines or shifts.
Comparing repair time with total downtime can reveal delays outside the repair itself. Record waiting time separately to see whether parts, technician availability, or tools are extending the stop. As Erik Hupjé, founder of Reliability Academy, puts it:

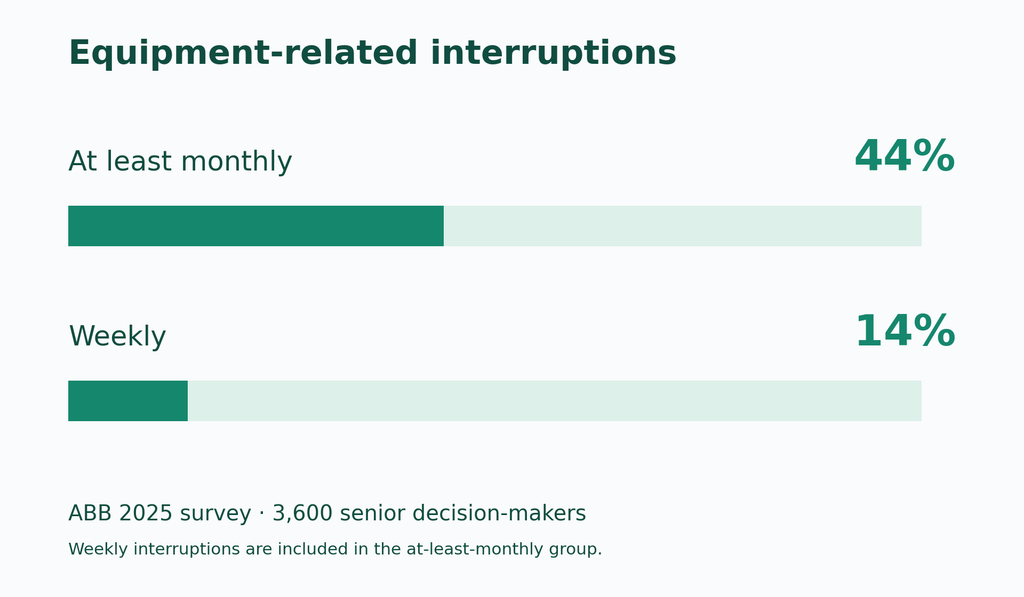
These numbers matter more than you might think, because stops aren’t rare. In a 2025 ABB survey of 3,600 senior decision-makers, 44% said they deal with equipment-related interruptions at least once a month, and 14% at least once a week.
Machine Downtime Tracking Software
Downtime tracking software falls into three groups, and each covers a different part of the problem.
- CMMS manages maintenance work and records downtime alongside the repair.
- Machine monitoring and OEE tools detect and time stops from machine signals, including short stops where the setup supports them.
- MES runs production on the floor, and downtime is one of many things it tracks.
Here’s how five of these tools compare:
| Tool | Type of software | How downtime is captured | How reasons are entered | Best for | Pricing model |
|---|---|---|---|---|---|
| Vorne XL | Production monitoring device with built-in software | One or two sensor inputs on the line, no PLC programming changes | By operators at the device, by touchscreen or barcode scanner | Lines that need a live scoreboard and OEE data | One-time purchase per unit, $4,490–$4,990, no recurring fees listed |
| WorkTrek | CMMS | Technicians record downtime on work orders and requests in the mobile app | On the work order, alongside the repair | Maintenance teams that want downtime tied to repairs and asset history | Per user per month: Starter $29, Professional $49, Enterprise on request |
| Evocon | Cloud OEE and production monitoring | A sensor on the line, connected to Evocon’s IIoT device | Operators categorize stops in the Evocon interface | Production teams tracking OEE across lines | Per machine per month, billed annually: $219–$379 (1-year term) or $189–$319 (3-year term), plus an IIoT device fee |
| MachineMetrics | Machine monitoring and MES platform | Data from connected machines, with no operator input and no minimum stop length | Rules assign reasons from alarms and machine state; operators resolve the rest in batches | Discrete manufacturers, such as machine shops | Custom quote |
| Guidewheel | Cloud operating platform for manufacturing | Sensors on the machine’s power conductor, no PLC integration to start | Operators log reasons on an operator dashboard | Multi-plant manufacturers with mixed equipment | Annual subscription, from $25,000 |
Here’s what sets each one apart.
Vorne XL is the only tool here sold as hardware you buy once, with a scoreboard that operators see at the line.
WorkTrek is a CMMS, not a monitoring tool. It records the downtime technicians log on work orders and requests, rather than detecting stops from machine signals.
Evocon, on the other hand, prices per machine and publishes its rates, making it easy to budget line by line.
MachineMetrics pulls data from the machines themselves and can assign many downtime reasons automatically, based on alarms.
Guidewheel reads electrical activity from a machine’s power conductor, so it works on equipment without a controller to connect to.
To choose between the types, answer three questions first:
- What machines do you run? Modern CNC machines can report their own status. Older or mixed equipment usually needs sensors on the power supply.
- Where do your losses come from? If breakdowns and long repairs drive downtime, start with a CMMS. If short stops, slow cycles, and changeovers do, start with monitoring.
- What will IT allow? Check whether cloud software is approved and whether the machines can reach a network.
If you’re losing time to breakdowns and short stops alike, it makes sense to run a monitoring tool and a CMMS together. With a supported integration configured, selected downtime events can trigger a maintenance request automatically.
Conclusion
Whichever method you start with, downtime data is only trustworthy when every stop is recorded with the same fields, reason codes, and definitions.
You can start this week: pick one critical machine, write its reason codes and downtime rules on one page, and log every stop for a few weeks. The results will show you where to go next.