Get a Free WorkTrek Demo
Let's show you how WorkTrek can help you optimize your maintenance operation.
Try for freeKey Takeaways:
- Workers spend up to 30 hours a week dealing with process inefficiencies.
- In manufacturing, annual downtime costs exceed $200 million.
- 36% of employees believe poor communication leads to rework and wasted time.
If we told you that skipping just one step in your maintenance workflow could cost $135 million, would you believe us?
Because that’s exactly what happened to a technician working on a NASA satellite in 2003.
In maintenance, the impact of strict procedural compliance on operational stability, safety, profitability, and reputation is often neglected.
As a result, companies rarely invest time in analyzing their current processes, improving them where possible, and ensuring that workers follow them.
The fact that you’re reading this article already proves you’re one step ahead.
In it, you’ll learn all about maintenance process mapping, the foundation of workflow transparency and optimization.
We break down what process mapping entails, including common techniques, benefits, and best practices, so that you can ensure maximum efficiency and protect your company from costly mistakes.
What is Maintenance Process Mapping
Maintenance process mapping is the visual documentation of every step in a maintenance workflow, from start to finish.
Its primary objective is to help you and your team better understand your current process so you can then identify critical dependencies, decision points, strengths, and areas for improvement.
There are several visualization techniques you can use for process mapping. Let’s look at some of the most common ones.
Flowcharts are the simplest and most widely used method:
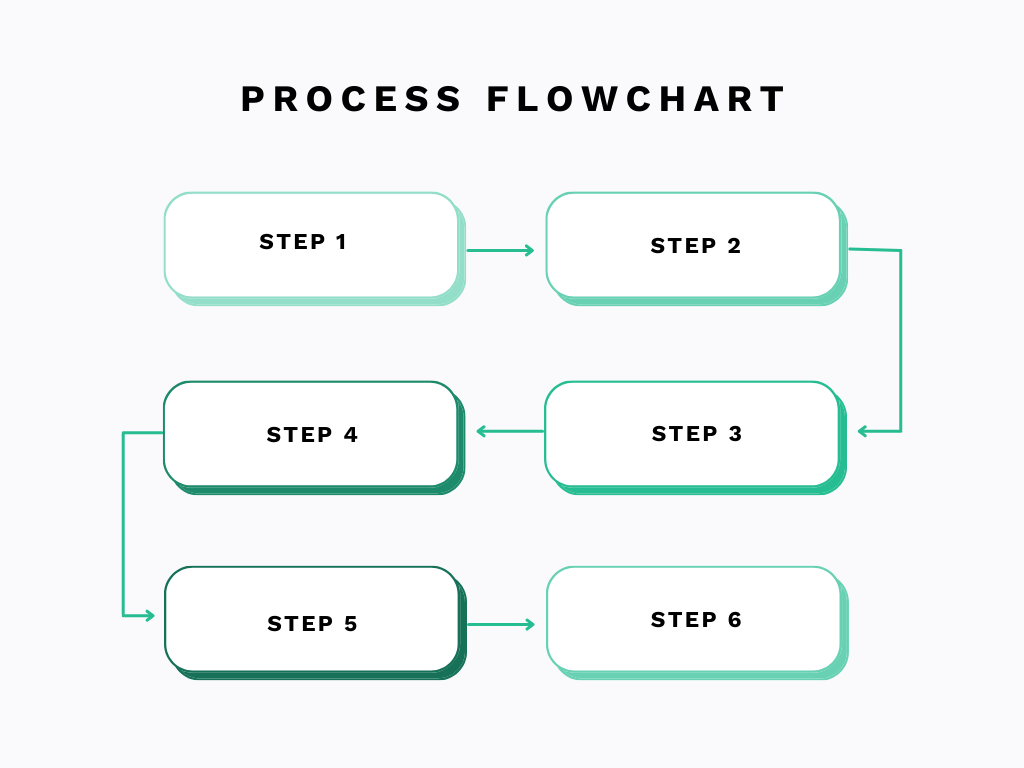
They use a standardized set of symbols to represent inputs, outputs, and the sequence of activities in a process.
You’ll likely find that this technique covers most of your process mapping needs.
Swimlane diagrams, also known as cross-functional flowcharts, organize a process by dividing responsibilities into horizontal or vertical “lanes”, with each lane representing a specific person, role, or team:
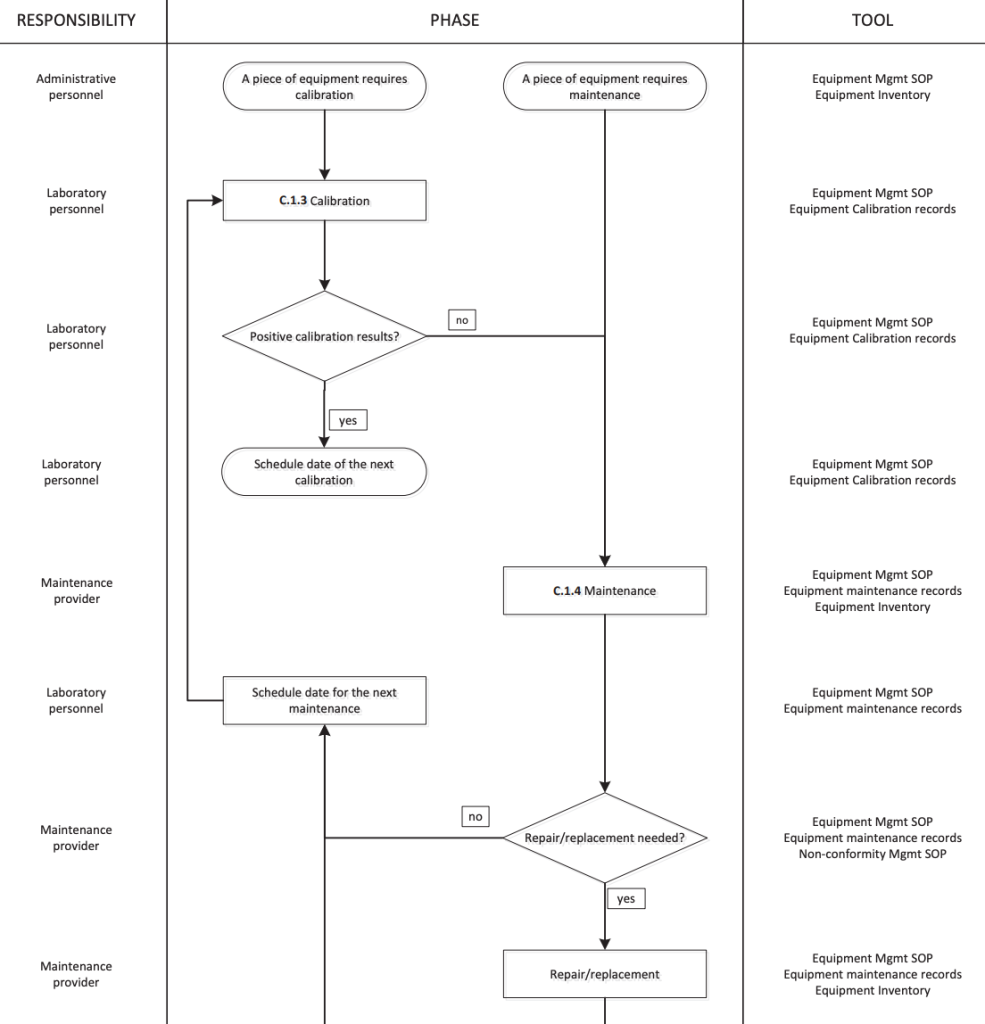
If your goal is to clarify roles and responsibilities across multiple teams, this format will work better than a standard flowchart.
Originating from Toyota and forming a cornerstone of lean methodology, value stream maps are designed to track the complete journey of a product or service, from initiation to delivery:
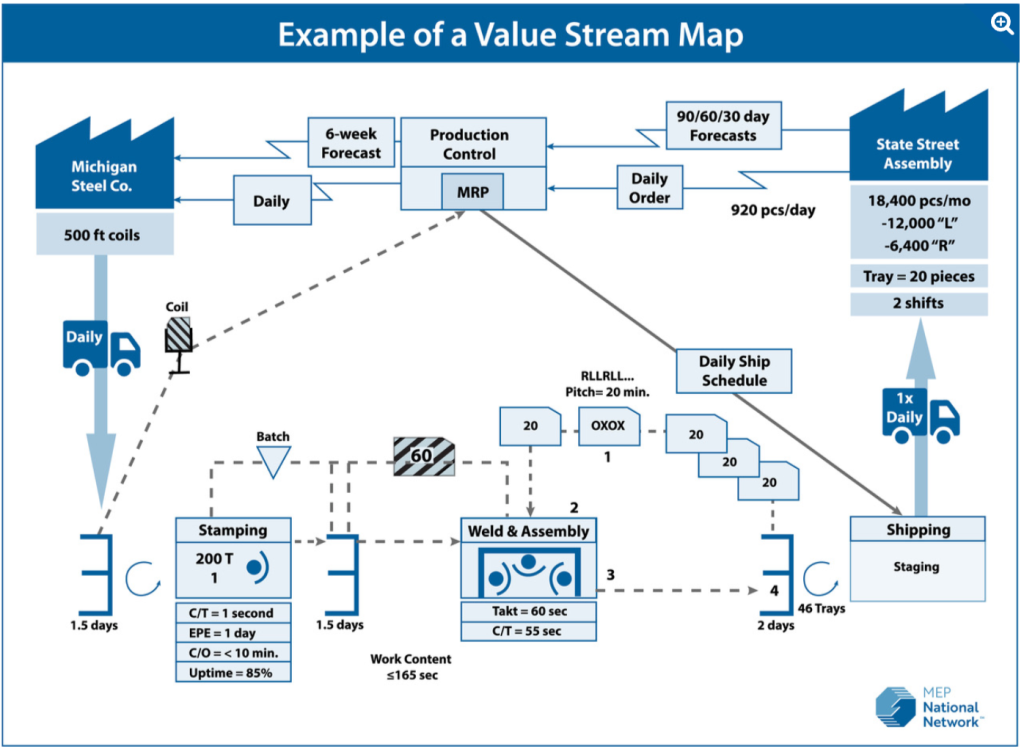
They use specialized symbols to illustrate how data and materials flow through each step of the process, capturing insights such as cycle time, number of people involved, and areas where waste occurs.
This technique is more advanced and best suited for getting a thorough view of complex systems, particularly in manufacturing environments.
Lastly, SIPOC diagrams are a high-level process mapping tool that provides a bird’s-eye view of a workflow by summarizing its key components:
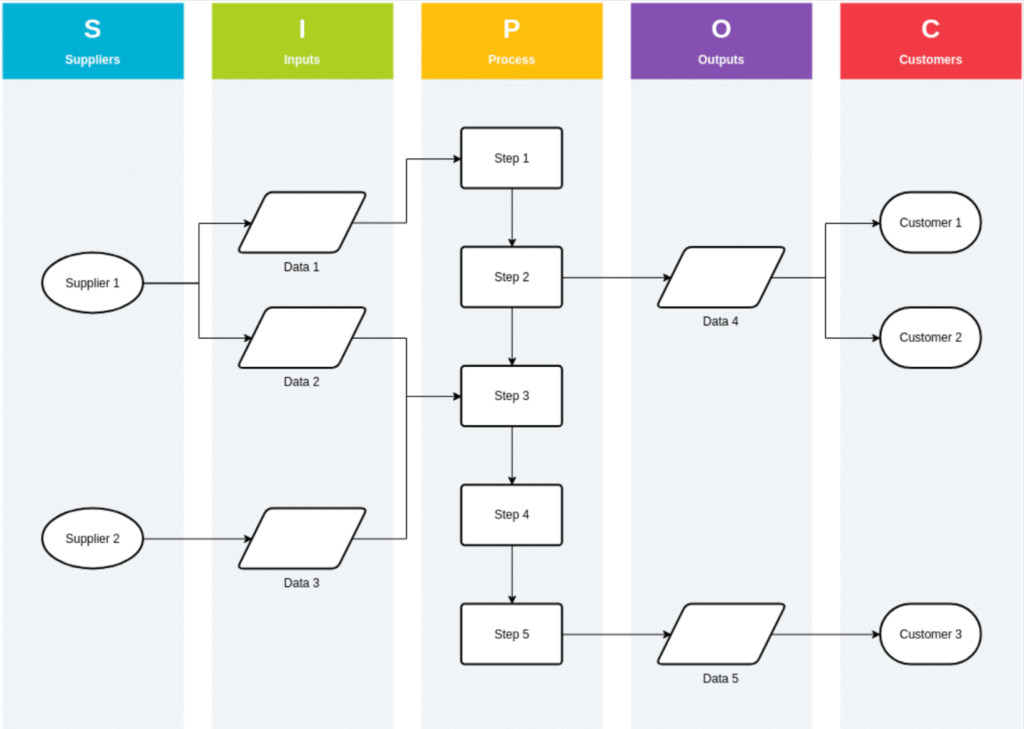
The acronym stands for Suppliers, Inputs, Process, Outputs, and Customers.
Popularized through the Six Sigma methodology, SIPOC diagrams are particularly useful for defining the scope of a complex process before moving into detailed analysis.
They ensure everyone shares a clear understanding of the process without becoming overwhelmed by too much detail.
Benefits of Mapping Your Maintenance Process
The main goal of process mapping is to better understanda better understanding of current processes.
Let’s explore why that matters in the first place, and what you stand to gain from accurate process mapping.
Ensures Everybody Follows the Same Steps
Since a process map visually lays out each step of a process, it significantly reduces reliance on tribal knowledge and ensures that everyone follows a single, standardized workflow.
So, instead of asking colleagues what to do, skipping steps, and making errors, all technicians, from seasoned professionals to new hires, know exactly what to do, how to do it, and when to do it.
A survey by Panopto suggests that this can dramatically boost productivity.
On average, workers spend eight hours a week solving problems through trial and error, reworking tasks, or searching for the information they need to do their jobs.
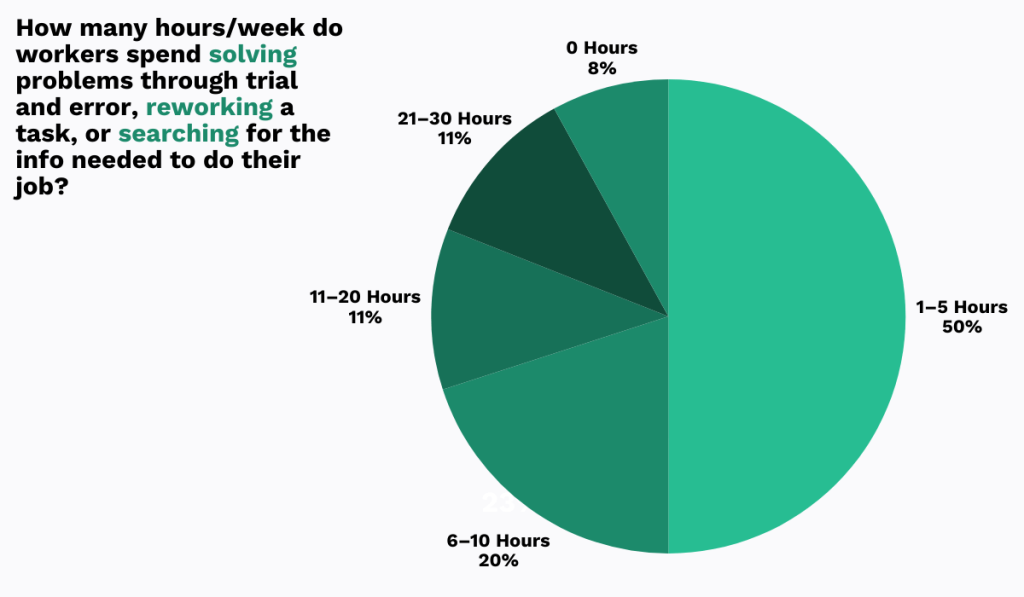
However, a well-designed process map provides all instructions upfront, thereby eliminating guesswork, saving time, reducing safety risks, and even improving overall work quality.
One well-known incident from 2003 perfectly illustrates how missing even a single step, no matter how small, can cause significant damage.
Back then, a Lockheed Martin technician working on a NASA weather satellite removed the bolts that secured the satellite to the turnoverturn-over cart (TOC) after he completed his work.
However, he forgot one simple yet vital step: documenting their removal.
Because this action was not recorded, the team that was using the turnoverturn-over cart later had no idea that the bolts were missing.
As they carefully rotated the 14-foot satellite, it fell approximately three feet onto the concrete floor.
Unsurprisingly, the impact caused severe damage to the highly sensitive equipment: $135 million worth of damage, to be exact.

This goes to show how important it is to follow each and every step of a maintenance workflow, no matter how insignificant it may seem.
With a process map that explicitly defines all the necessary actions, you increase the likelihood of compliance with the procedure across the team, reducing the risk of costly incidents like the one at Lockheed Martin.
Helps Identify Process Inefficiencies
Maintenance process maps can also serve as diagnostic tools, helping you uncover hidden problems inact as a diagnostic tool, helping you uncover hidden problems within your workflows.
One of the biggest challenges in maintenance is that most process inefficiencies stay invisible because they don’t cause immediate or obvious damage.
As a result, issues such as work orders sitting unnoticed for days, technicians traveling back and forth unnecessarily, or excessive waiting for spare parts often go unaddressed.
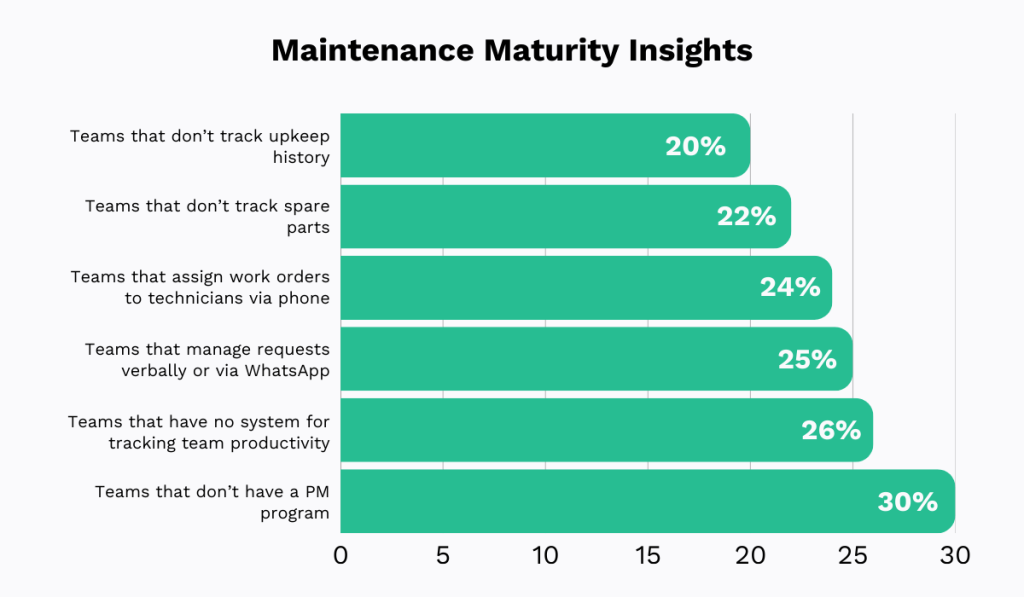
The 2025 Zapium research shows that many maintenance teams still operate at a very low level of maturity, relying on manual processes and lacking a systematic way to track productivity, among other issues, with no systematic way to track productivity, and so on.
In such environments, inefficiencies tend to compound and feed ononly tend to compound and trigger one another, creating a snowball effect and wasting time and money.
This is where process mapping makes all the difference by increasing workflow visibility and clearly showing who does what, when, and how long each step takes.
With this kind of transparency, you are far better equipped to apply lean thinking, eliminate non-value-added activities, simplify decision paths, and reduce cycle times.
This is especially important in industries that depend on continuous, high-volume, or just-in-time operations, where even a single minute of downtime can be extremely costly.
For example, findings from Splunk research indicate that retail and manufacturing industries are among the hardest hit by downtime, with annual costs exceeding $200 million.
Even in less-affected sectors, downtime costs can surpass $140 million per year.
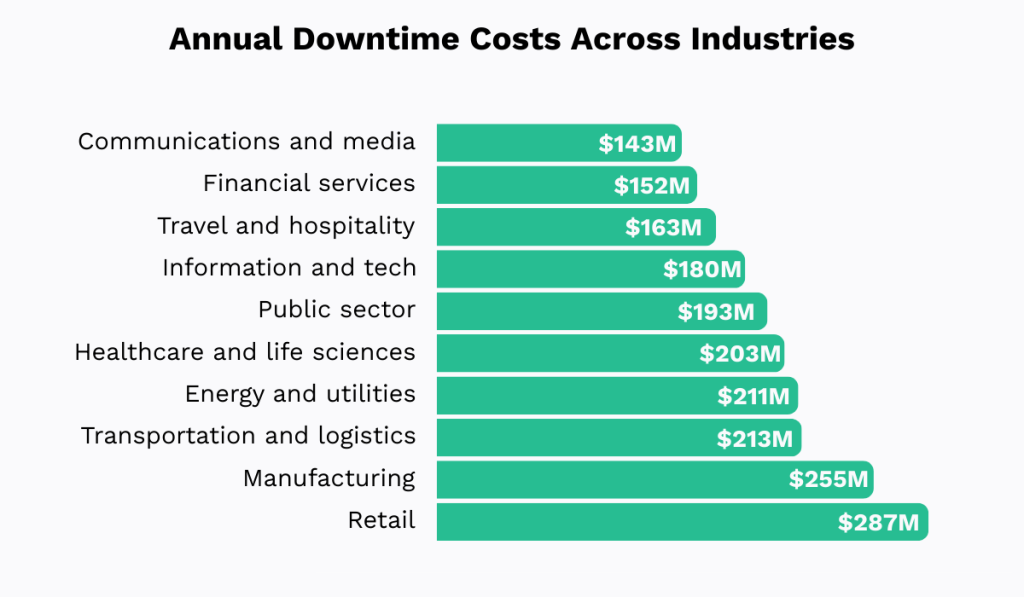
In other words, regardless of the industry, the financial impact of interrupted operations is enormous.
Maintenance plays a vital role in preventing these disruptions, but only if it operates efficiently.
Process maps help make that possible by laying out the entire workflow from start to finish and exposing areas where time, resources, and labor are being wasted.
Simplifies Onboarding
New hires are often the ones who struggle most when processes are unclear, undocumented, informal, or vary depending on whom they ask.
So, for them, process maps are incredibly valuable.
They provide a clear, visual overview of the big picture, showing how their role fits into the broader system, and reducing reliance on informal “shadow learning.”
In other words, they act as a single source of truth, clarifying what to do, when to do it, and who to involve from day one.
Such a streamlined approach to onboarding ultimately leads to faster time to productivity, fewer mistakes, and a better overall experience for everyone involved.
The 2024 survey by Enboarders supports this, showing that a well-structured onboarding journey increases employee satisfaction, productivity, engagement, and more.

That’s right.
Onboarding can significantly influence how employees feel about their work, making them happier, more committed, and even more likely to stay with the company long-term.
Therefore, its importance should not be underestimated.
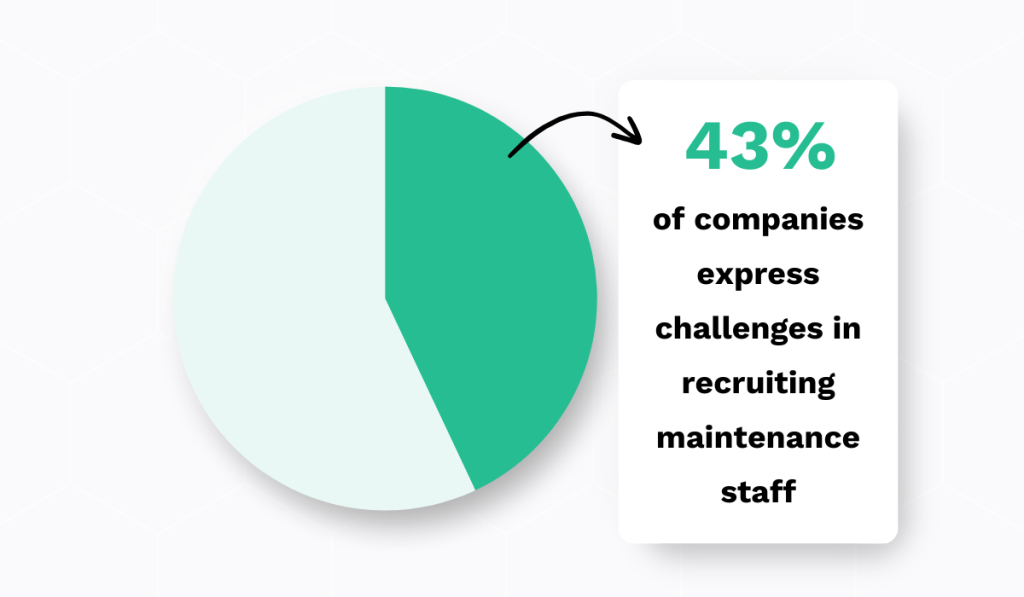
This is particularly true today, as maintenance, like many skilled trades, faces ongoing labor shortages as more experienced professionals retire or leave, with more and more experienced professionals retiring or leaving the workforce.
In fact, according to a survey by ABB, 43% of maintenance teams reported difficulties recruiting qualified staff in 2023.
Sure, you may not be able to create more skilled workers overnight, but you can influence how well you support and retain the ones you have.
Equip them with clear guidance, practical knowledge, and the right tools to work efficiently and safely, and you foster confidence, pride in the work they do, and, in turn, loyalty.
Process maps are the fundamental first step in making that happen.
Best Practices for Developing a Maintenance Process Map
To unlock these benefits, however, you need to ensure you approach the maintenance process mapping the right way.
Here are some best practices that will help you get there.
Start With One Core Process
Instead of trying to map all maintenance activities, like WO procedure, PM scheduling, spare parts management, etc., at once, begin with just one process.
If you attempt to map every possible workflow right away, it can quickly become overwhelming, and you may lose focus.
Starting with a single process, on the other hand, creates clarity, builds momentum, and establishes a standard you can use to map future processes.
When deciding which process to map first, consider the following factors:
- Production impact
- Safety and compliance impact
- The level of inefficiency in the process
- The cost of inefficiencies in the process
The process with the greatest impact across these areas is a good place to start.
In maintenance environments, these highest-impact workflows are typically related to work order or preventive maintenance management.
Once you’ve chosen the mapping processprocess to map, don’t overcomplicate it.
Your first version can be simple, just like the one you see below:
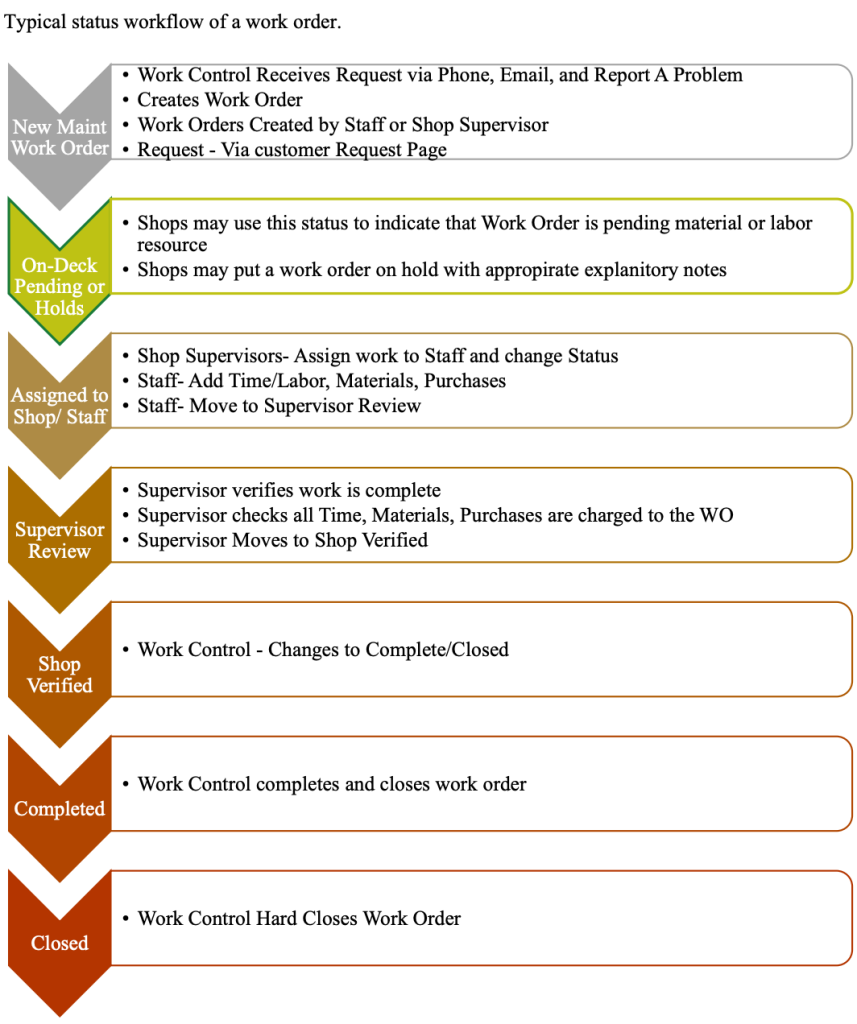
Even a basic workflow diagram is often enough for onboarding and ensuring consistent execution.
However, if your needs are more complex, you can gradually add more detail.
One Reddit user offers some valuable advice:
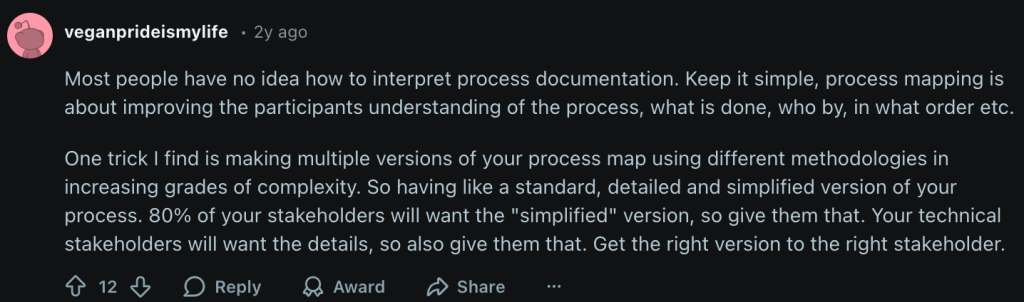
By tailoring the version to the audience, you ensure clarity without overwhelming anyone, yourself included.
At the same time, this approach allows you to build strong process mapping capabilities step by step, starting with one core process and gradually advancing to more detailed analysis across your operations.
Involve Cross-Functional Stakeholders
Maintenance doesn’t happen in isolation.
Your processes likely touch operations, procurement, engineering, finance, and other departments, with each group offering a unique perspective.
That’s why it’s important to include representatives from all groups that interact with the process you’re mapping out.
Otherwise, you miss the full picture.
Research from Panopto has already shown that nearly half of employee knowledge is unique.

By involving everyone in the mapping process, you tap into that unique knowledge, creating maps that accurately reflect each workflow, including hidden bottlenecks and dependencies.
After all, collaboration and communication are at the heart of any successful task.
Without it, efficiency plummets.
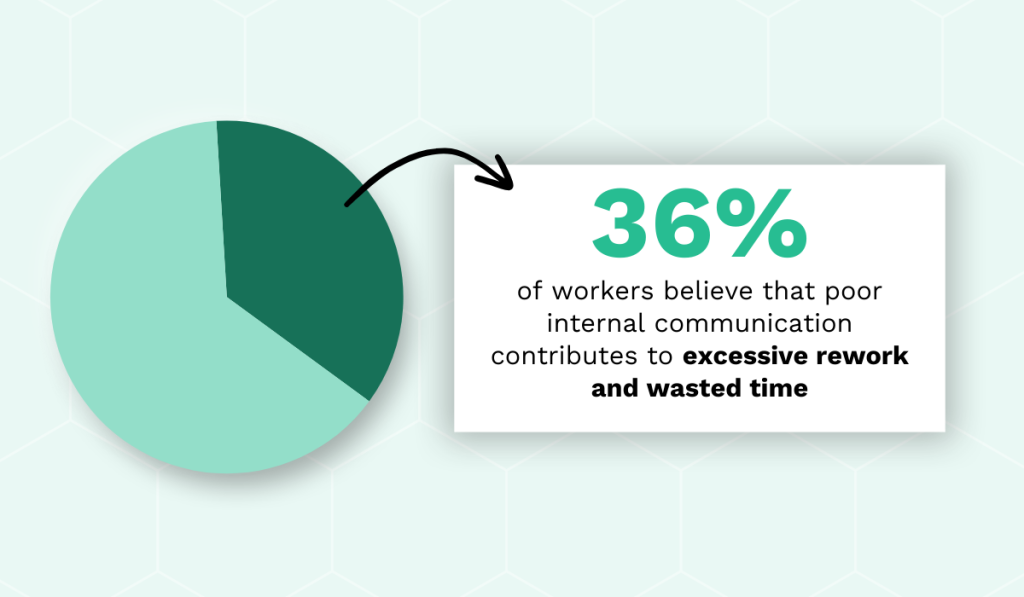
The 2023 Oak Engage study confirms this, showing that over a third of employees believe poor internal communication leads to excessive rework and wasted time.
That’s exactly what can happen if you don’t ask your colleagues for help: mistakes, extra revisions, and wasted time.
To ensure successful communication and cooperation, consider using collaboration platforms.
Many of these platforms offer features like digital whiteboards, where team members can brainstorm, provide feedback, and add comments, photos, videos, or drawings.
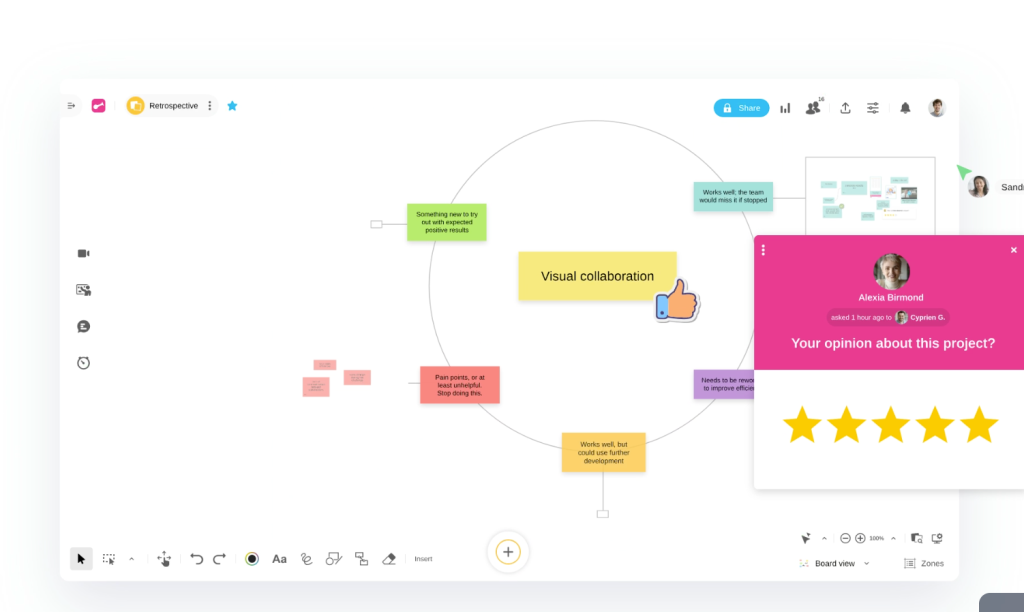
This is especially valuable if you’re working on your map with hybrid teams, as it enables everyone to contribute from anywhere.
In the end, when all teams collaborate, you gain a thorough understanding of the process from all relevant perspectives.
This makes your process maps that much more accurate, relevant, and actionable.
Use Your CMMS to Validate the Process Map
Asking your colleagues to help with process mapping is incredibly important, but so is grounding your findings in hard data.
Therefore, after mapping the process as perceived by the teams, compare those insights against actual system data from your CMMS.
Daniel Golub, Sales and Marketing Leader specializing in SaaS businesses, explains why CMMS solutions are such a valuable source of truth:

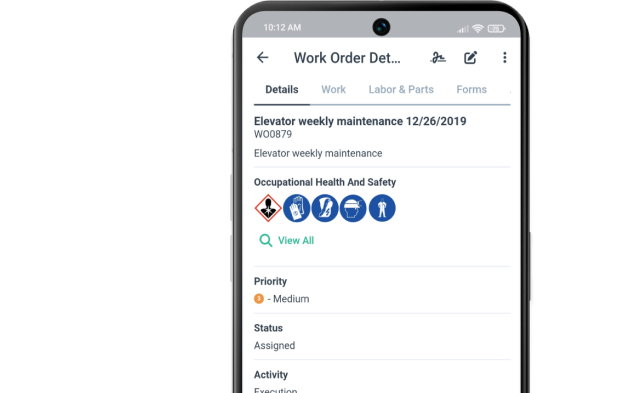
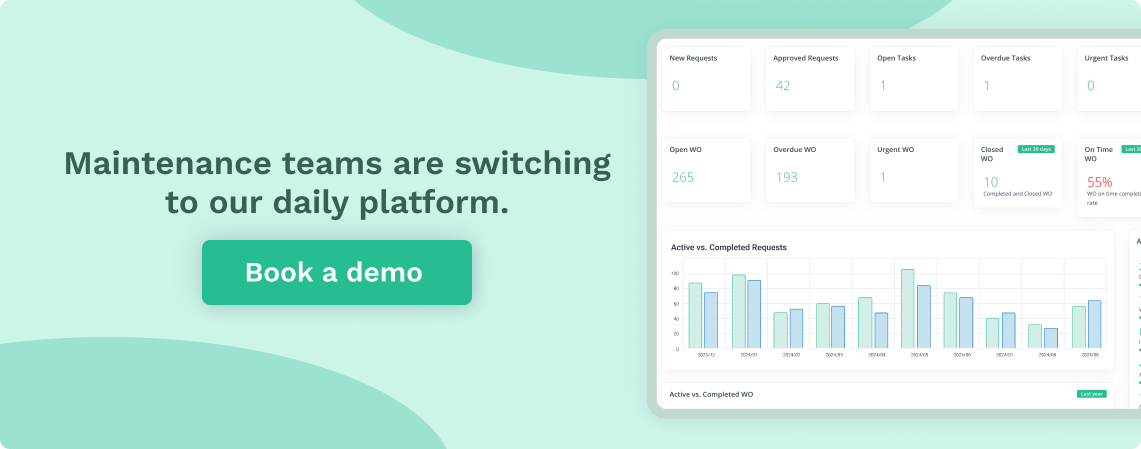
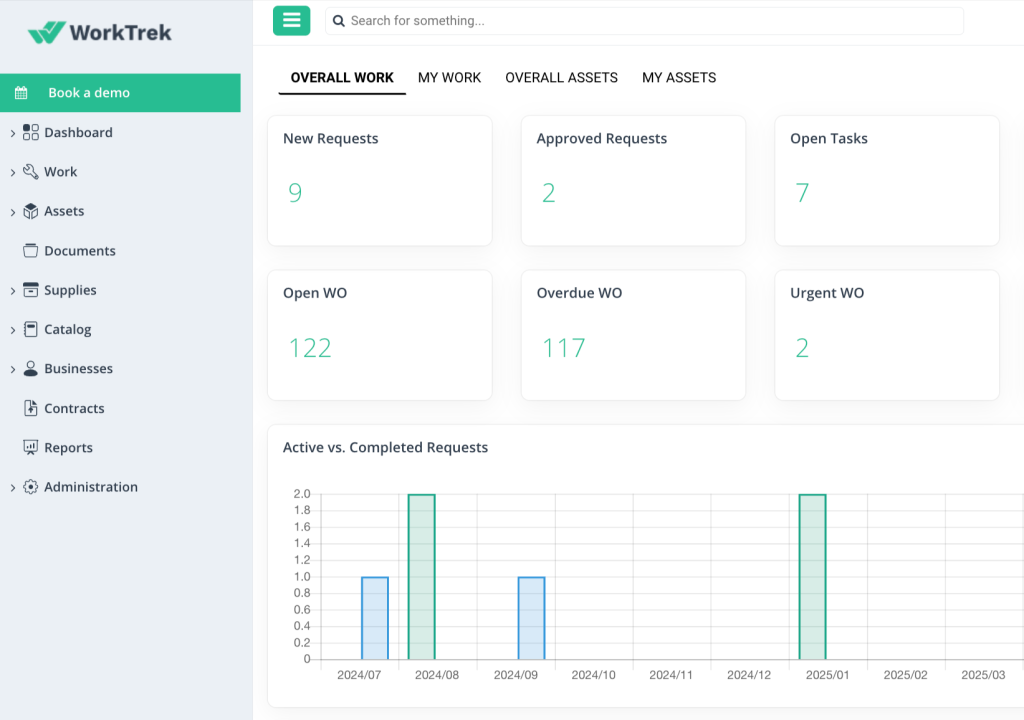
Take our own CMMS, WorkTrek, for example.
It lets you log everything related to maintenance operations, including work requests and orders, PM schedules, completed tasks, spare parts, invoices, asset profiles, and more.
However, this isn’t just data for data’s sake.
Over time, this information builds a clear picture of your operations and highlights inefficiencies, making your process mapping more data-driven.
WorkTrek’s dashboard provides a brief overview of key insights, like open work orders, overdue tasks, on-time completions, and planned vs. actual expenses.
Additionally, if you’re interested in a deeper analysis, you can use our reporting feature to track metrics such as parts usage, backlog hours, PM schedule compliance, and take advantage of our reporting feature that tracks various metrics like parts usage, backlog hours, PM schedule compliance, and much, much more.
This data allows you to verify whether the documented process matches reality.
For instance, a WO process may seem smooth according to the team, but if the system shows numerous overdue WOs, something might be off, and you may need to investigate further.
Overall, bias in process mapping is nearly inevitable.
People often describe processes based on what should happen, what used to happen, or what they think happens.
With WorkTrek, however, you can see what actually happens, unlocking greater transparency than ever before.
Conclusion
Hopefully, it’s now clear that efficient maintenance processes don’t happen by accident or luck.
They are carefully mapped out, continuously monitored, and regularly refined to meet the company’s evolving needs.
It’s not that other teams have bigger budgets, more advanced equipment, or teams that are more hardworking.
No, they simply take the time to identify areas for improvement and address them.
That’s great news for you because it means you can achieve the same results.
It all starts with an accurate, thorough process map, developed collaboratively with all relevant teams and supported by real operational data.