Get a Free WorkTrek Demo
Let's show you how WorkTrek can help you optimize your maintenance operation.
Try for freeKey Takeaways:
- Productivity compares maintenance output to time and resources used.
- CMMS simplifies accurate productivity data collection.
- Wrench time in most facilities is between 18 and 30%.
- Leading organizations aim for at least 85% planned maintenance and less than 15% reactive work.
Everyone wants their maintenance to be productive.
But what does that mean, and how do you measure it?
Is it about how fast tasks get done? Or how much time technicians spend turning wrenches?
Yes—but there’s more to it.
Productivity is a ratio: the balance between inputs (time and materials) and outputs (uptime or reduced costs).
To measure it accurately, you need to define the right metrics, track them consistently, and address obstacles.
Let us show you how to do that.
Define Inputs and Outputs
Before measuring maintenance productivity, you need to understand what you’re putting in and what you expect to get out.
Inputs are everything you invest in maintenance work:
- Technician labor hours
- Spare parts
- Tools
- Contractor services
These are fairly straightforward to quantify.
You can track them in your CMMS or through time logs, work orders, and material usage records.
Outputs, on the other hand, are harder to pin down.
Maintenance doesn’t produce a physical product, so its value is often measured indirectly.
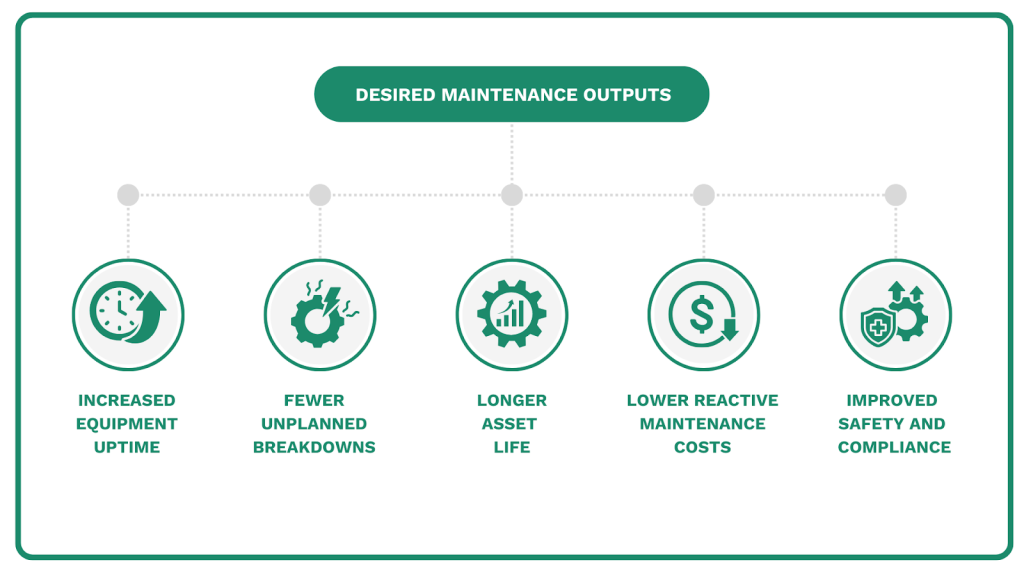
Maintenance outputs include increased equipment uptime, fewer unplanned breakdowns, longer asset life, lower reactive maintenance costs, and improved safety or compliance.
These real results matter to operations, but they take time to realize and aren’t always easy to tie to one technician or work order.
That’s why it’s essential to define these outputs clearly before you try to measure productivity.
Otherwise, you risk rewarding busywork instead of meaningful results.
And productivity is, by definition, a ratio of outputs over inputs.
As Jim Pazos, a drilling and completion fluids engineer, explains, maintenance productivity is about resource usage and value delivered.

In other words, it reflects the work’s quality and its contribution to operational success.
Framing productivity this way shifts the focus from getting things done to getting the right things done efficiently and consistently.
That’s the foundation for all the KPIs and benchmarking that follow.
Set the Right KPIs
Once you’ve defined your inputs and outputs, setting the right KPIs is next.
The key is to focus on a mix of metrics reflecting the value of work.
You want to measure efficiency and effectiveness because productivity depends on both.
Here are the KPIs to consider.
Wrench Time
Wrench time is one of the most common KPIs for tracking efficiency.
It tells you the percentage of a technician’s shift spent doing hands-on maintenance work.
Here is a simple formula for calculating it:
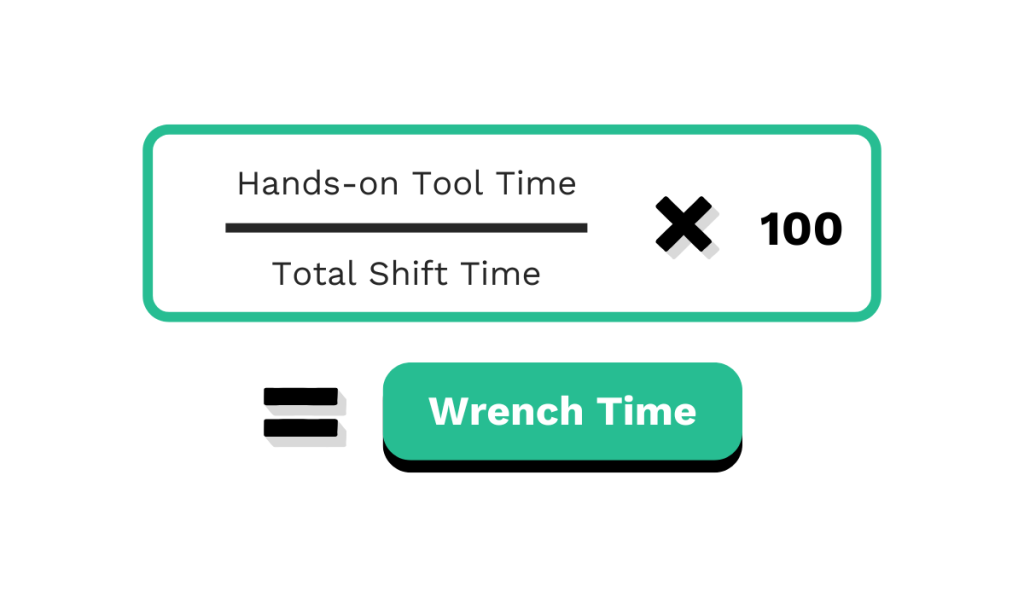
According to Reliable Plant, world-class organizations typically report wrench time between 55 and 65%, but most facilities operate closer to 20 or 30% in practice.
That gap reflects the time lost to tasks such as searching for tools, waiting for permits, or walking long distances between jobs.
However, wrench time has its limits.
Just because someone is busy doesn’t mean the work they’re doing is impactful, as one Reddit user pointed out:
“I realize that time spent working doesn’t automatically translate to productivity, but this helps me quickly see how diligent I’ve been about work.”
That’s a fair observation.
Still, while wrench time doesn’t tell you whether the work is valuable, it gives you a clear picture of how much time is spent performing it.
That makes it a useful indicator of input-based productivity.
Time Lost to Delays
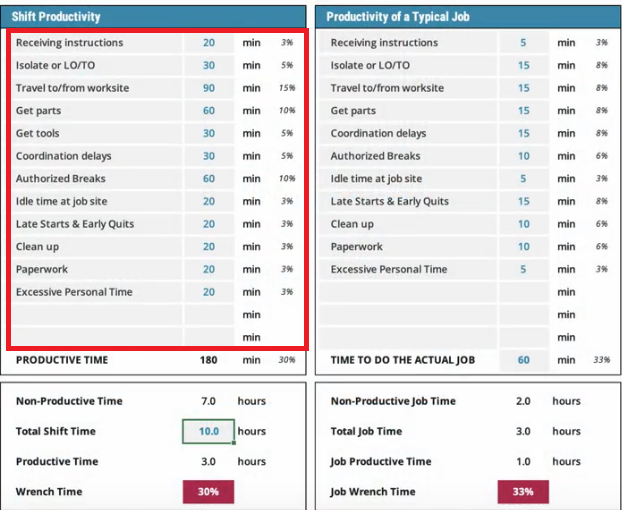
If wrench time tells you how much time is spent working, this KPI shows you where time is not used productively.
You can track time lost to delays such as waiting for parts, permits, or approvals, getting tools, receiving instructions, and more.
These waiting periods may seem minor, but they add up fast and often go unnoticed, as a calculator below shows.
Tracking these times can help you identify the root causes of delays, including:
- Inefficient maintenance planning
- Poor inventory management
- Unclear communication
With clear insights into lost time, you can start reducing delays, ultimately helping technicians stay focused, shortening job durations, and improving overall productivity.
Planned vs. Actual Time for Tasks
To examine the situation more thoroughly, you can compare the planned time for a task to the actual time it took to complete it.
Here is how to calculate that variance:
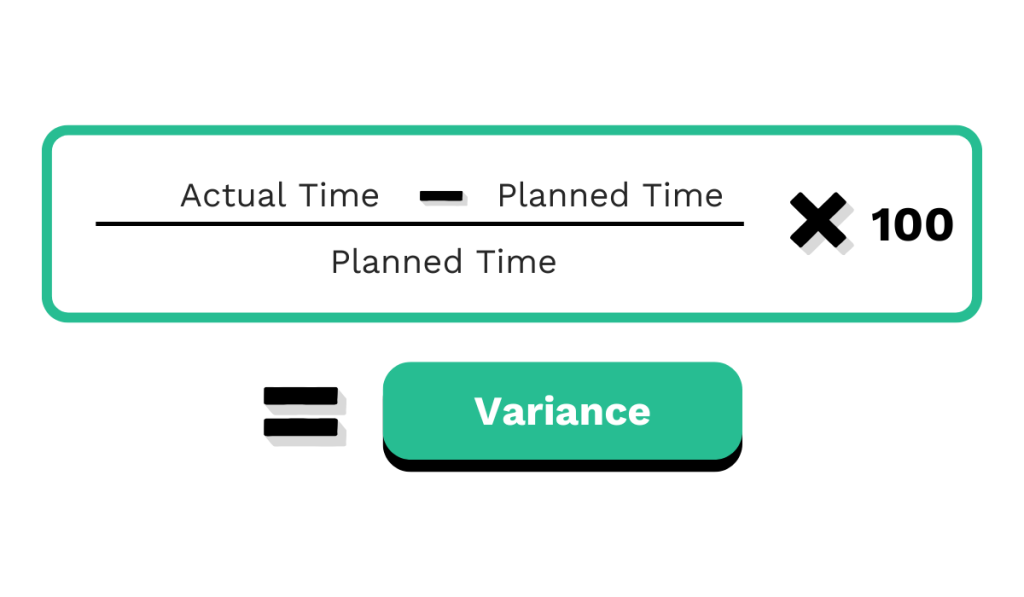
This KPI highlights how realistic your maintenance planning is and whether execution is on track.
If tasks consistently run over their estimated time, it might signal delays, poor planning, or inefficiencies in work performance.
Over time, this can reveal patterns that harm productivity, such as chronic underestimation, skill gaps, or logistical issues.
Schedule Compliance
Schedule compliance tells you how well your team follows the planned maintenance schedule.
The formula is simple:
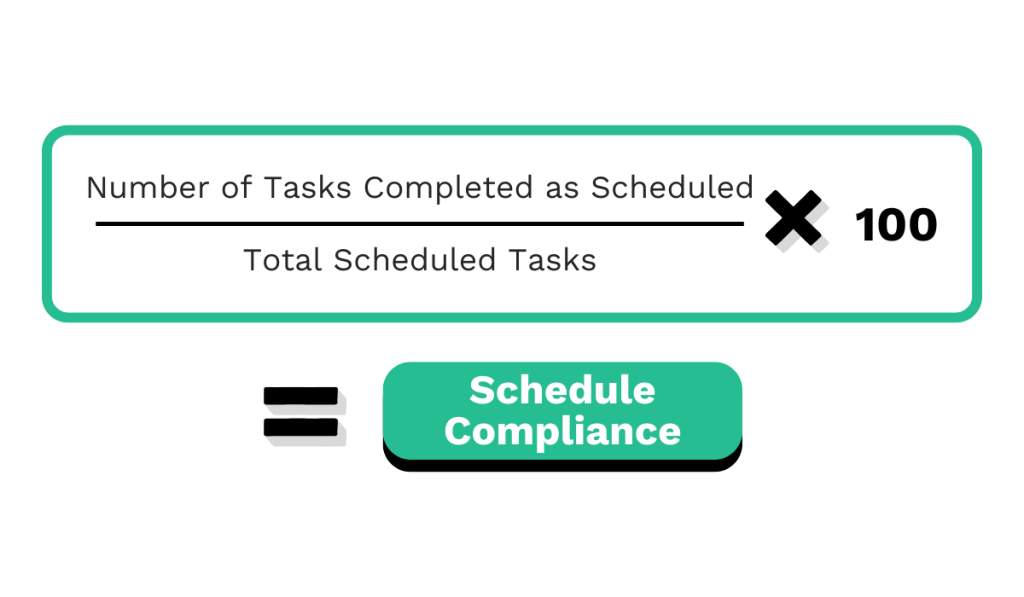
Deviating too often from the schedule typically means that unplanned, reactive work is taking over, disrupting routines and lowering productivity by pushing aside more efficient, proactive tasks.
High compliance shows that your team can follow through with the plan, a sign of operational stability.
Planned vs. Reactive Maintenance
Just as important is the percentage of planned versus reactive maintenance.
This KPI compares the amount of work scheduled in advance to the amount that had to be handled on the fly.
Ideally, most of your maintenance should be planned, as reactive work is unpredictable, inefficient, and often more expensive.
A high proportion of reactive tasks means technicians are constantly pulled off course, which destroys productivity by creating delays, confusion, and stress.
First-time Fix Rate
It’s also helpful to track the first-time fix rate, which measures the percentage of work orders that are completed successfully on the first visit without needing to redo the job.
Here is a formula to calculate the first-time fix rate:
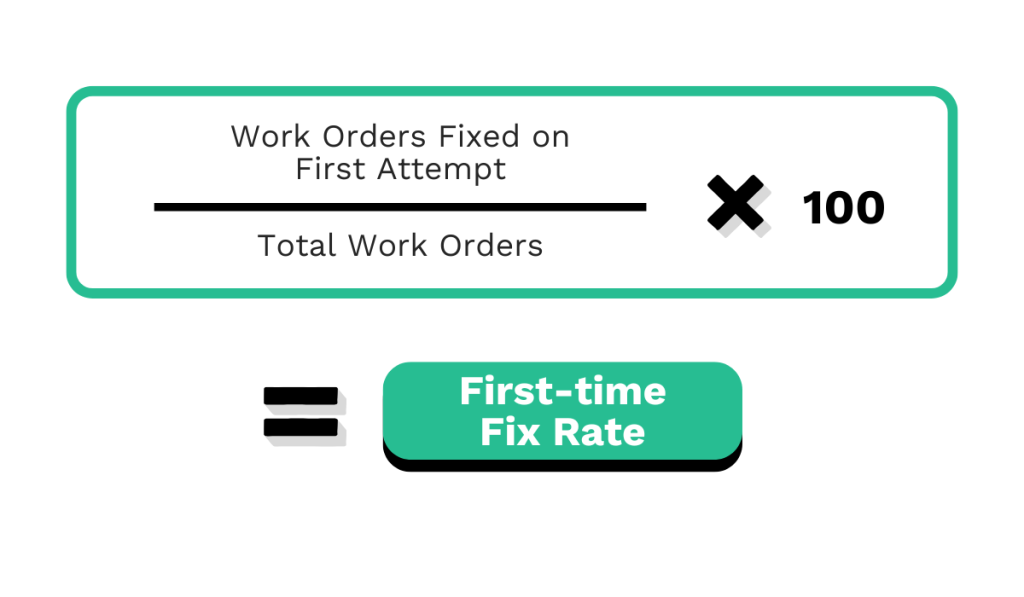
A low first-time fix rate suggests problems with training, diagnosis, or parts availability, all of which waste time and reduce output.
By improving this rate, you directly improve both productivity and asset reliability.
Work Order Completion Rate
Another valuable metric is the work order completion rate, which measures how many scheduled work orders are completed within a given timeframe.
To calculate it, use this simple formula:
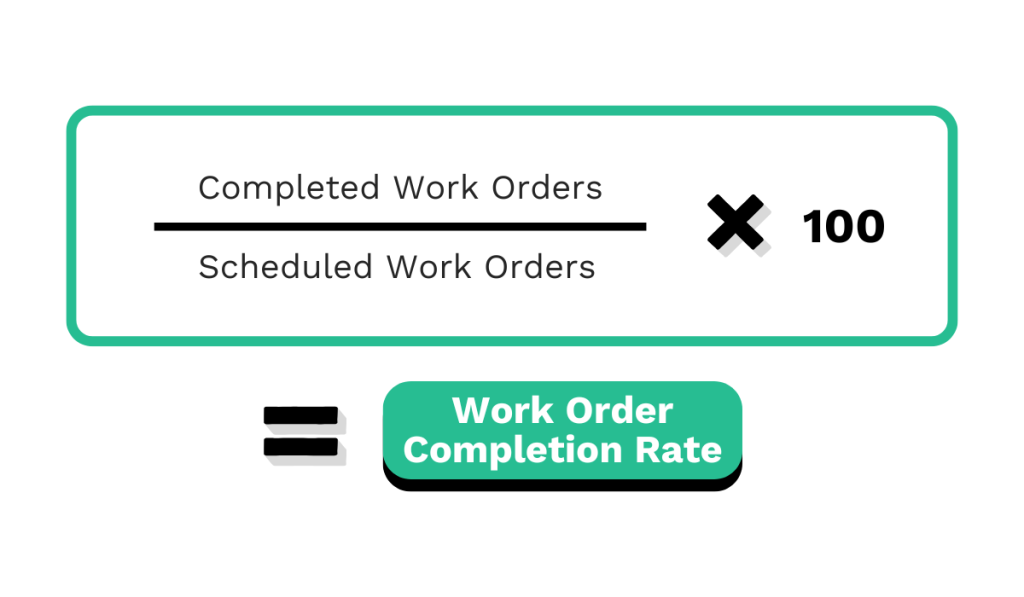
A high completion rate suggests strong throughput and planning discipline, essential for maintaining maintenance operations productive and predictable.
This KPI shows whether your team consistently moves work forward or falls behind due to a backlog or reactive disruptions.
Mean Time to Repair (MTTR)
You should also track the mean time to repair (MTTR) to assess how well maintenance activities support uptime and restore operations.
MTTR shows how long it takes, on average, to fix an asset after a failure occurs.
A lower MTTR indicates that your team is quick to respond and resolve issues, which reduces downtime and improves operational performance.
It’s a powerful output-based measure of productivity because it directly connects your team’s actions to equipment availability.
Cost per Work Order
Finally, cost per work order ties everything together by connecting resource usage, such as labor hours and materials, to financial outcomes.
The cost per work order rises if technicians take too long on simple jobs or consume too many parts.
That’s a sign of inefficiency, and when viewed alongside the other KPIs, it can help you pinpoint where money and time are being wasted.
Together, these KPIs give you a full view of maintenance productivity.
Some show how efficiently work is performed, while others reveal whether that work is helping your operations run better.
No single metric tells the whole story, but combined, they help you identify gaps, optimize performance, and track progress over time.
Most importantly, they help shift your focus from simply doing the work to doing the right work, in the right way, with the best possible outcome.
Collect Useful Data
Now that you have your KPIs, it’s time to collect data to support them.
But it’s not enough to know what to track.
You also need a reliable tracking system that captures both the work being done and the resources being used, without adding unnecessary complexity to the technicians’ (and your) workflows.
A CMMS is by far the most effective way to do this.
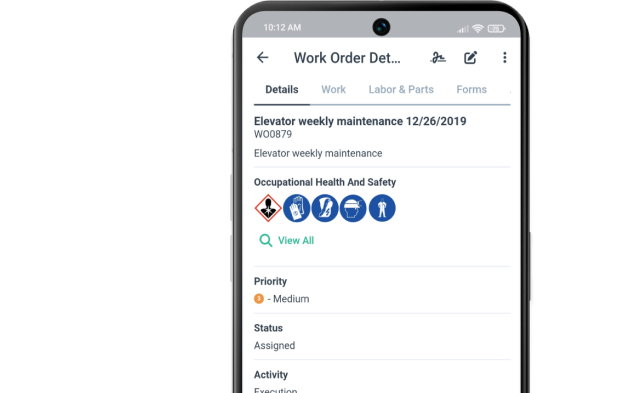
A platform like WorkTrek allows you to log time, track spare parts, and document work orders in real time, all from a tablet or smartphone.
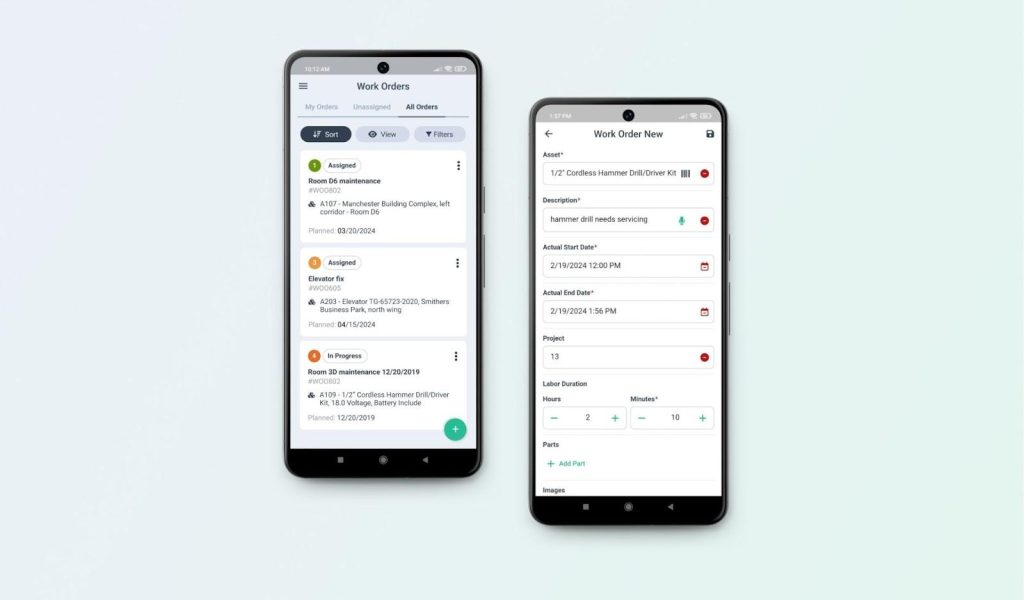
This makes it easier for technicians to record their work as they go, rather than trying to remember details at the end of the day or week.
The more effortless the process, the more likely you are to get clean, consistent data, which directly improves the quality of your productivity metrics.
For example, when a technician clocks into a work order through the CMMS, the system starts tracking how long the task takes.
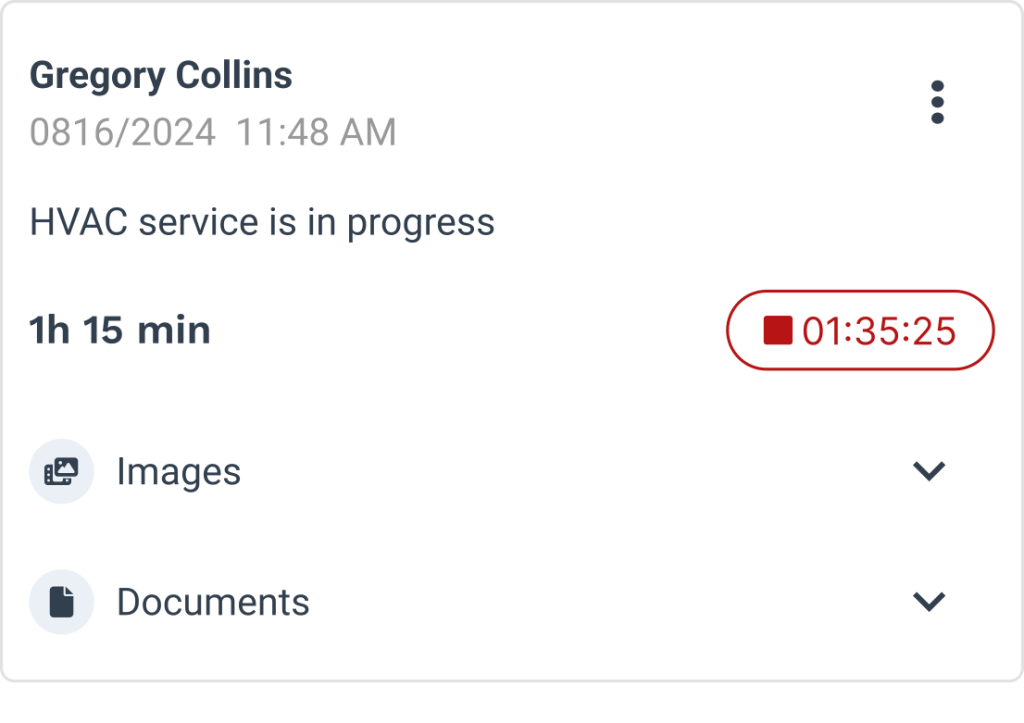
That timestamp becomes the foundation for calculating metrics like wrench time or planned versus actual task duration.
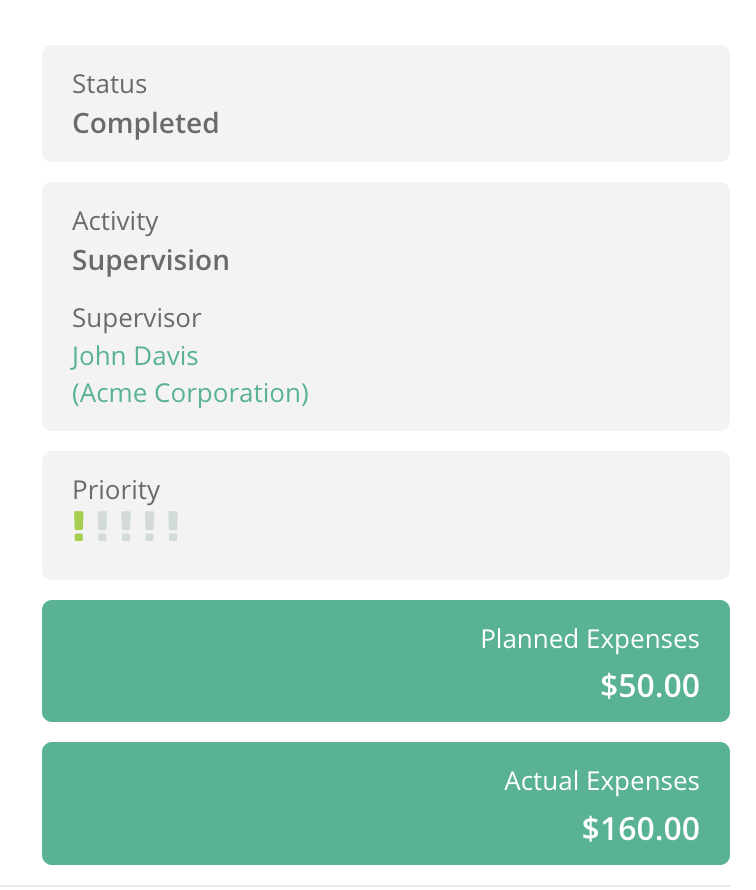
The same applies to parts usage and costs.
If you assign parts and materials directly to a work order inside the system, you can see exactly how much was used for each job and at what cost.
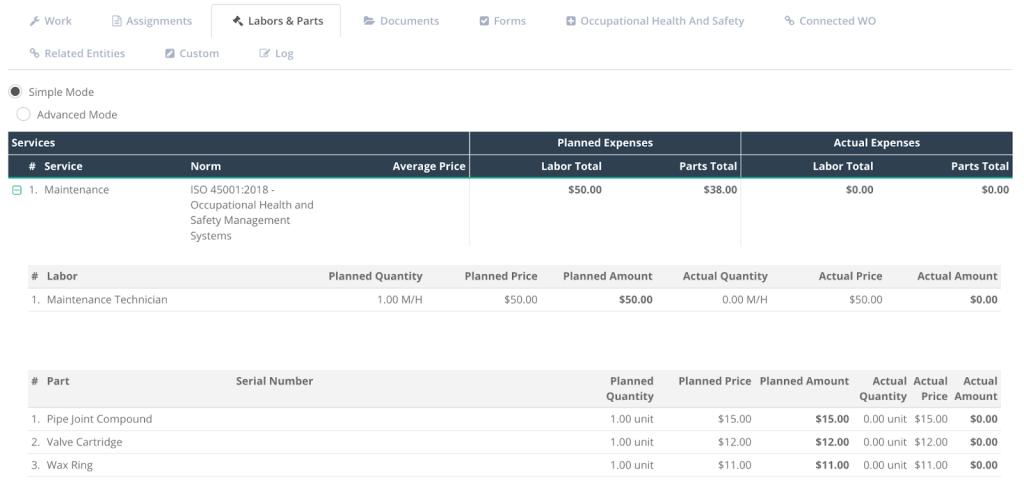
This kind of data feeds directly into KPIs like cost per work order.
For example, think of a routine maintenance task that normally takes 2 hours and uses 3 parts.
If you notice that this same task is suddenly taking 4 hours and using 7 parts, that’s a clear sign that something is off.
By noticing it quickly through a higher-than-usual cost per work order, you can investigate whether it’s just a one-time issue, like a particularly worn-out machine, or if it’s happening regularly.
If it happens often, it might mean your team needs more training, or that the job isn’t being planned properly, so you can fix the root cause before costs and downtime grow.
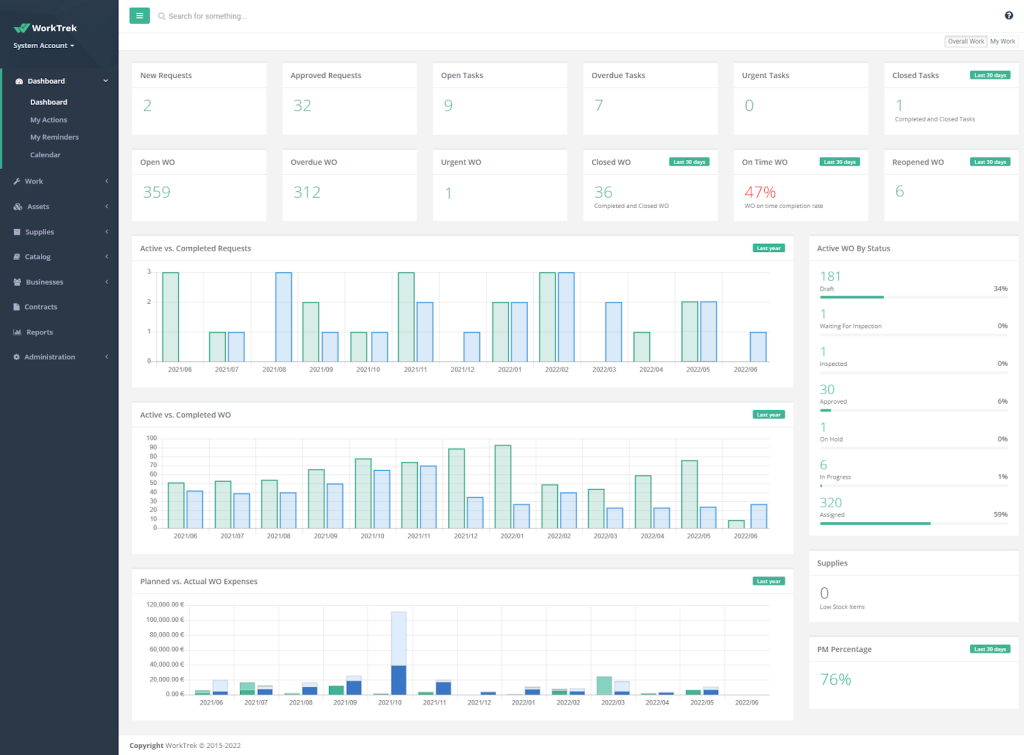
Another major advantage of using a CMMS is automation.
You can set up reports and dashboards to update automatically, pulling from live data to show productivity trends over time.
If wrench time starts to drop or the percentage of reactive work begins to increase, you’ll see it immediately.
In short, using a CMMS is the easiest and most effective way to collect useful data for productivity tracking.
It captures the data you need for your KPIs, simplifies reporting, and creates a feedback loop that helps you continuously improve.
Benchmark Performance
Productivity data is only useful if you compare it against a clear standard.
That’s why you have to benchmark productivity to help you better understand how your team is performing.
Take wrench time as an example.
As mentioned, world-class maintenance teams typically achieve 55–65% wrench time, but most facilities report wrench time between 18 and 30%.
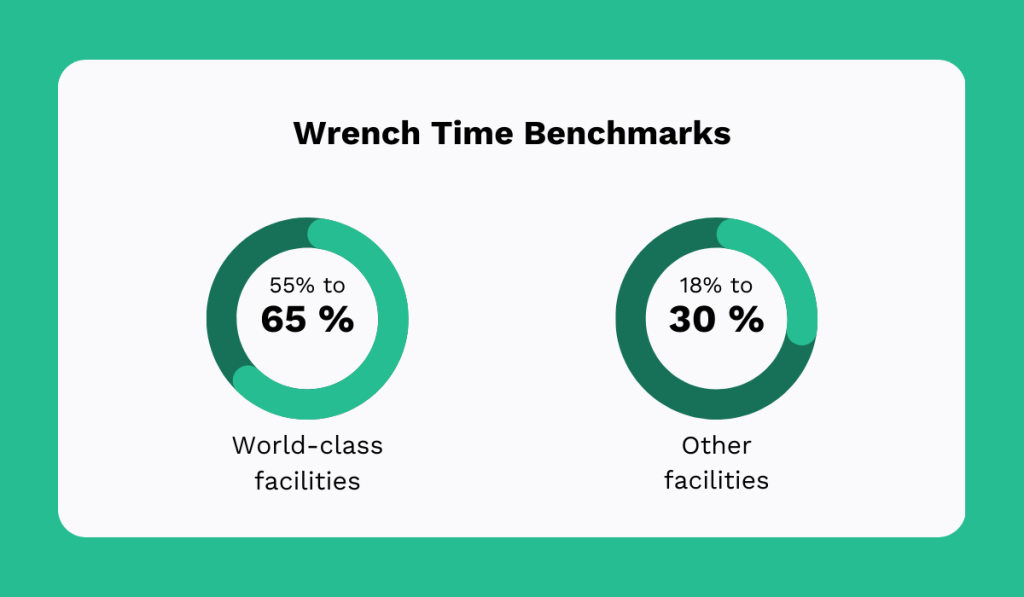
Comparing your wrench time to this benchmark helps you see inefficiencies.
A low percentage will point out planning issues, tool availability problems, or other bottlenecks that hurt overall productivity.
Another useful benchmark is your planned vs. unplanned maintenance ratio.
Leading organizations aim for at least 85% planned work and less than 15% reactive.
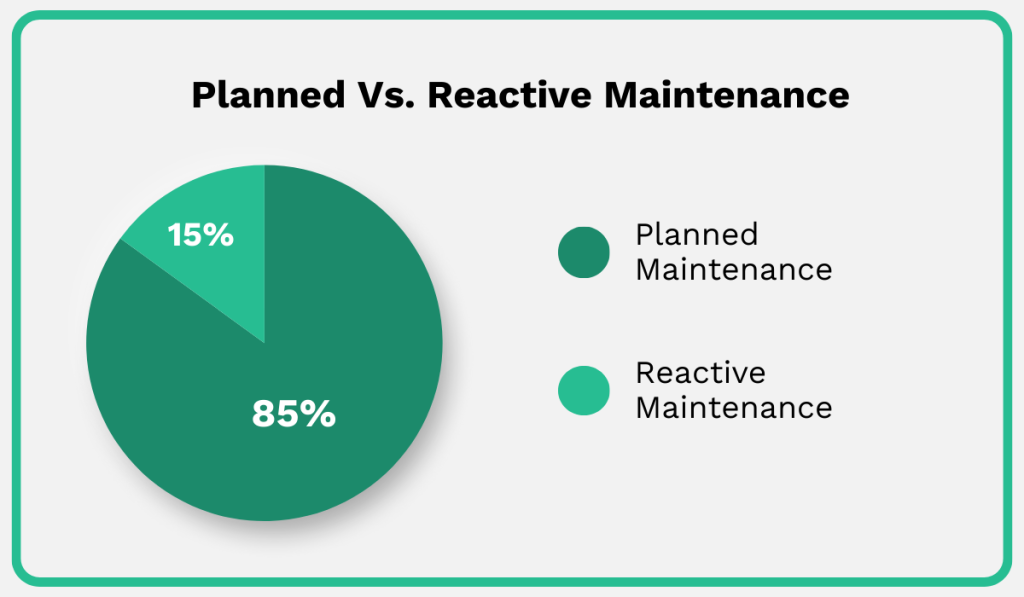
If your ratio is flipped—or even close to 50/50—it’s a sign that emergencies are running the show.
That reactive environment makes it nearly impossible to use your team’s time effectively.
Benchmarking this ratio helps you understand how much control you have over your workload and where you’re losing productivity.
Unfortunately, benchmarking is not without its challenges, especially when it’s based on internal estimates rather than real-world data.
Sandy Dunn, a maintenance expert with over 40 years of experience, explains that many planners set task duration estimates based on gut feeling rather than evidence.
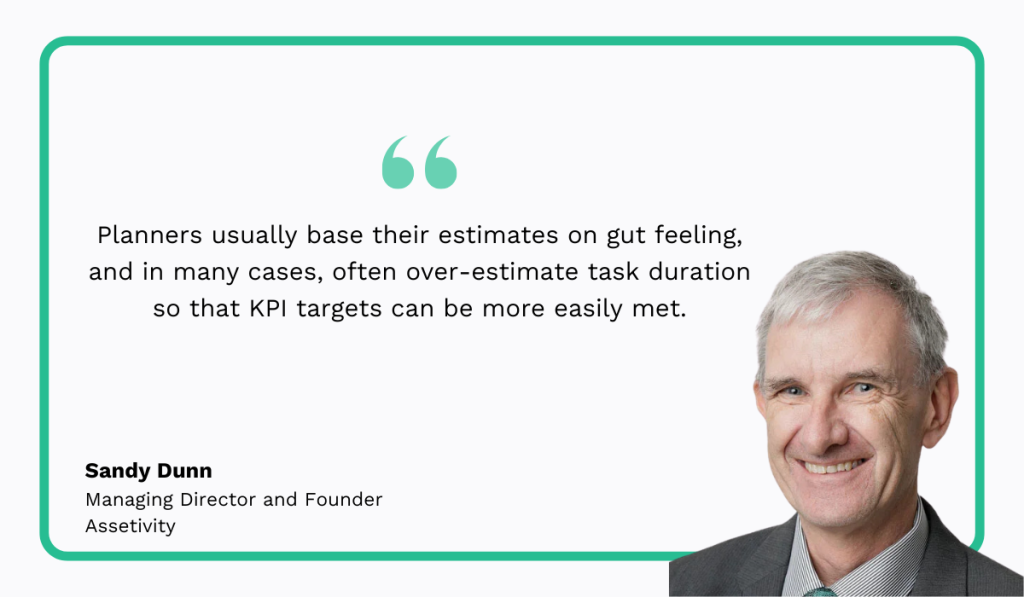
He further explains that when technicians consistently fail to meet the original estimates, planners often feel pressure to extend the time instead of identifying the root causes.
This results in benchmarks that look good on paper but hide the real issues.
Benchmarks have to reflect repeatable, real-world performance to be useful.
If you keep seeing the same delays on similar jobs, you’re not looking at isolated incidents but at a pattern.
And patterns point to deeper, systemic issues that need attention, which brings us to the final step.
Address Productivity Killers
Once you’ve identified the gaps, the final step is to address the common productivity killers behind them.
Even with strong planning, technicians often lose time waiting for permits, walking back and forth to find parts, or sitting idle between jobs due to poor scheduling.
Sometimes it’s not the task itself that’s the problem, but how it’s set up.
Vague instructions, missing materials, unclear priorities, or communication breakdowns can all eat into productive time without anyone realizing it.
This is where a CMMS becomes especially valuable.
A CMMS like WorkTrek can eliminate many of these issues by giving technicians everything they need in one place, from clear instructions, part assignments, and due dates to digital checklists attached to each work order.
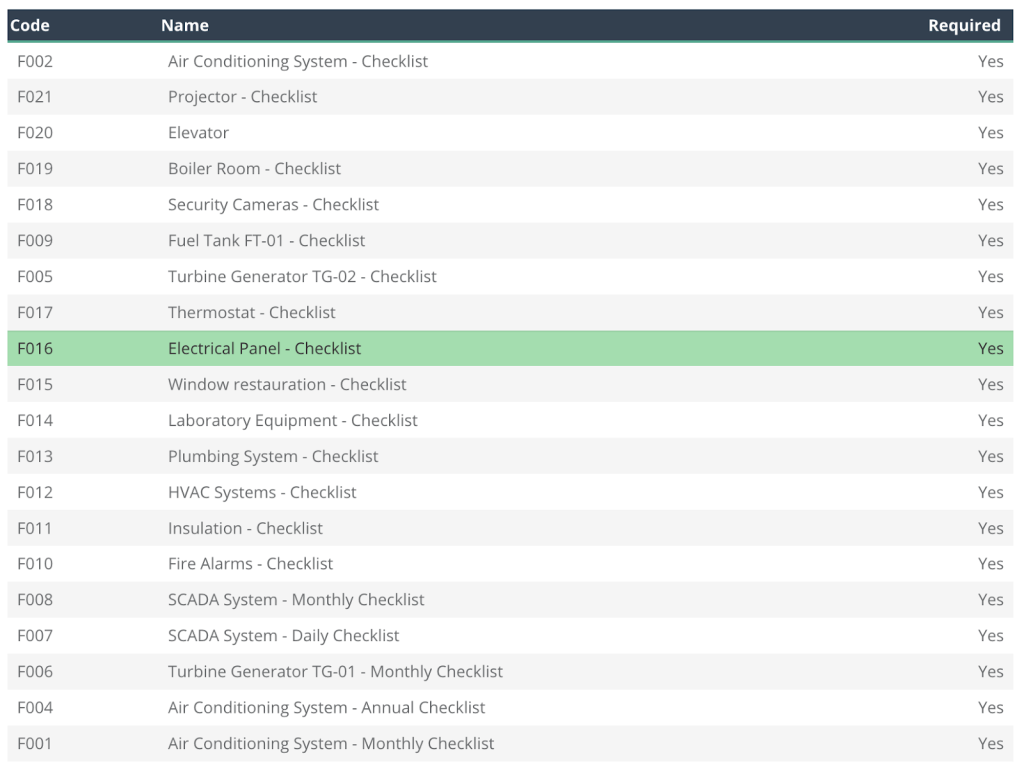
That last feature is especially useful.
Checklists ensure that every task is completed in the correct sequence, reducing rework and helping technicians complete their assignments faster and more confidently.
Scheduling also becomes far more efficient.
CMMS platforms often include simple drag-and-drop scheduling tools so you can easily assign the right technician to the right job, with the right parts, at the right time.
Some systems also offer map-based views, letting you visualize where all your assets are located.
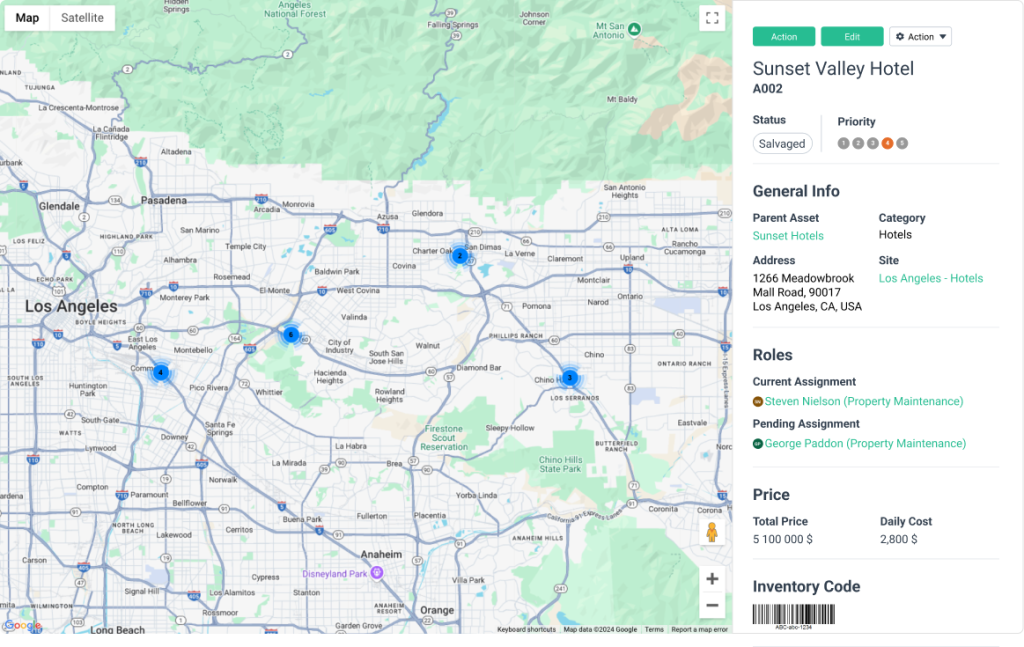
This allows you to group tasks by location and plan more logical routes, reducing wasted travel time between jobs and improving overall workflow efficiency.
These small adjustments in how work is planned, communicated, and executed can add up fast.
Over time, they lead to significant improvements in your team’s productivity.
Because at the end of the day, measuring productivity isn’t just about time logs or KPIs—it’s about using that information to fix what’s slowing your team down.
Once you know the bottlenecks, you’re in a much better position to remove them.
Conclusion
Measuring maintenance productivity gives you clarity.
Clarity on where time and resources go, where value is created, and where it’s lost.
So, define the right metrics, back them with reliable data, benchmark honestly, and you’ll see exactly how productive your maintenance is.
Then, use that insight to keep productivity up.