Blog

Operations & Maintenance
Maintenance Process Mapping: A Guide
Looking for a maintenance process mapping guide? This article will show you how to map workflows and improve efficiency step by step.
Key Takeaways:
Workers spend up to 30 hours a week dealing with process inefficiencies.
In manufacturing, annual downtime costs exceed $200 million.
36% of employees believe poor communication leads to rework and wasted time.
If we told you that skipping just one step in your maintenance workflow could cost $135 million, would you believe us?
Because that’s exactly what happened to a technician working on a NASA satellite in 2003.
In maintenance, the impact of strict procedural compliance on operational stability, safety, profitability, and reputation is often neglected.
As a result, companies rarely invest time in analyzing their current processes, improving them where possible, and ensuring that workers follow them.
The fact that you’re reading this article already proves you’re one step ahead.
In it, you’ll learn all about maintenance process mapping, the foundation of workflow transparency and optimization.
We break down what process mapping entails, including common techniques, benefits, and best practices, so that you can ensure maximum efficiency and protect your company from costly mistakes.
What is Maintenance Process Mapping
Maintenance process mapping is the visual documentation of every step in a maintenance workflow, from start to finish.
Its primary objective is to help you and your team better understand your current process so you can then identify critical dependencies, decision points, strengths, and areas for improvement.
There are several visualization techniques you can use for process mapping. Let’s look at some of the most common ones.
Flowcharts are the simplest and most widely used method:
Source: WorkTrek
They use a standardized set of symbols to represent inputs, outputs, and the sequence of activities in a process.
You’ll likely find that this technique covers most of your process mapping needs.
Swimlane diagrams, also known as cross-functional flowcharts, organize a process by dividing responsibilities into horizontal or vertical “lanes”, with each lane representing a specific person, role, or team:
Source: Swiss Biobanking Platform
If your goal is to clarify roles and responsibilities across multiple teams, this format will work better than a standard flowchart.
Originating from Toyota and forming a cornerstone of lean methodology, value stream maps are designed to track the complete journey of a product or service, from initiation to delivery:
Source: NIST
They use specialized symbols to illustrate how data and materials flow through each step of the process, capturing insights such as cycle time, number of people involved, and areas where waste occurs.
This technique is more advanced and best suited for getting a thorough view of complex systems, particularly in manufacturing environments.
Lastly, SIPOC diagrams are a high-level process mapping tool that provides a bird’s-eye view of a workflow by summarizing its key components:
Source: KPI Fire
The acronym stands for Suppliers, Inputs, Process, Outputs, and Customers.
Popularized through the Six Sigma methodology, SIPOC diagrams are particularly useful for defining the scope of a complex process before moving into detailed analysis.
They ensure everyone shares a clear understanding of the process without becoming overwhelmed by too much detail.
Benefits of Mapping Your Maintenance Process
The main goal of process mapping is to better understanda better understanding of current processes.
Let’s explore why that matters in the first place, and what you stand to gain from accurate process mapping.
Ensures Everybody Follows the Same Steps
Since a process map visually lays out each step of a process, it significantly reduces reliance on tribal knowledge and ensures that everyone follows a single, standardized workflow.
So, instead of asking colleagues what to do, skipping steps, and making errors, all technicians, from seasoned professionals to new hires, know exactly what to do, how to do it, and when to do it.
A survey by Panopto suggests that this can dramatically boost productivity.
On average, workers spend eight hours a week solving problems through trial and error, reworking tasks, or searching for the information they need to do their jobs.
Illustration: WorkTrek / Data: Panopto
However, a well-designed process map provides all instructions upfront, thereby eliminating guesswork, saving time, reducing safety risks, and even improving overall work quality.
One well-known incident from 2003 perfectly illustrates how missing even a single step, no matter how small, can cause significant damage.
Back then, a Lockheed Martin technician working on a NASA weather satellite removed the bolts that secured the satellite to the turnoverturn-over cart (TOC) after he completed his work.
However, he forgot one simple yet vital step: documenting their removal.
Because this action was not recorded, the team that was using the turnoverturn-over cart later had no idea that the bolts were missing.
As they carefully rotated the 14-foot satellite, it fell approximately three feet onto the concrete floor.
Unsurprisingly, the impact caused severe damage to the highly sensitive equipment: $135 million worth of damage, to be exact.
Source: The Morning News
This goes to show how important it is to follow each and every step of a maintenance workflow, no matter how insignificant it may seem.
With a process map that explicitly defines all the necessary actions, you increase the likelihood of compliance with the procedure across the team, reducing the risk of costly incidents like the one at Lockheed Martin.
Helps Identify Process Inefficiencies
Maintenance process maps can also serve as diagnostic tools, helping you uncover hidden problems inact as a diagnostic tool, helping you uncover hidden problems within your workflows.
One of the biggest challenges in maintenance is that most process inefficiencies stay invisible because they don’t cause immediate or obvious damage.
As a result, issues such as work orders sitting unnoticed for days, technicians traveling back and forth unnecessarily, or excessive waiting for spare parts often go unaddressed.
The 2025 Zapium research shows that many maintenance teams still operate at a very low level of maturity, relying on manual processes and lacking a systematic way to track productivity, among other issues, with no systematic way to track productivity, and so on.
Illustration: WorkTrek / Data: Zapium
In such environments, inefficiencies tend to compound and feed ononly tend to compound and trigger one another, creating a snowball effect and wasting time and money.
This is where process mapping makes all the difference by increasing workflow visibility and clearly showing who does what, when, and how long each step takes.
With this kind of transparency, you are far better equipped to apply lean thinking, eliminate non-value-added activities, simplify decision paths, and reduce cycle times.
This is especially important in industries that depend on continuous, high-volume, or just-in-time operations, where even a single minute of downtime can be extremely costly.
For example, findings from Splunk research indicate that retail and manufacturing industries are among the hardest hit by downtime, with annual costs exceeding $200 million.
Even in less-affected sectors, downtime costs can surpass $140 million per year.
Illustration: WorkTrek / Data: Splunk
In other words, regardless of the industry, the financial impact of interrupted operations is enormous.
Maintenance plays a vital role in preventing these disruptions, but only if it operates efficiently.
Process maps help make that possible by laying out the entire workflow from start to finish and exposing areas where time, resources, and labor are being wasted.
Simplifies Onboarding
New hires are often the ones who struggle most when processes are unclear, undocumented, informal, or vary depending on whom they ask.
So, for them, process maps are incredibly valuable.
They provide a clear, visual overview of the big picture, showing how their role fits into the broader system, and reducing reliance on informal “shadow learning.”
In other words, they act as a single source of truth, clarifying what to do, when to do it, and who to involve from day one.
Such a streamlined approach to onboarding ultimately leads to faster time to productivity, fewer mistakes, and a better overall experience for everyone involved.
The 2024 survey by Enboarders supports this, showing that a well-structured onboarding journey increases employee satisfaction, productivity, engagement, and more.
Illustration: WorkTrek / Data: Enboarders
That’s right.
Onboarding can significantly influence how employees feel about their work, making them happier, more committed, and even more likely to stay with the company long-term.
Therefore, its importance should not be underestimated.
This is particularly true today, as maintenance, like many skilled trades, faces ongoing labor shortages as more experienced professionals retire or leave, with more and more experienced professionals retiring or leaving the workforce.
In fact, according to a survey by ABB, 43% of maintenance teams reported difficulties recruiting qualified staff in 2023.
Illustration: WorkTrek / Data: ABB
Sure, you may not be able to create more skilled workers overnight, but you can influence how well you support and retain the ones you have.
Equip them with clear guidance, practical knowledge, and the right tools to work efficiently and safely, and you foster confidence, pride in the work they do, and, in turn, loyalty.
Process maps are the fundamental first step in making that happen.
Best Practices for Developing a Maintenance Process Map
To unlock these benefits, however, you need to ensure you approach the maintenance process mapping the right way.
Here are some best practices that will help you get there.
Start With One Core Process
Instead of trying to map all maintenance activities, like WO procedure, PM scheduling, spare parts management, etc., at once, begin with just one process.
If you attempt to map every possible workflow right away, it can quickly become overwhelming, and you may lose focus.
Starting with a single process, on the other hand, creates clarity, builds momentum, and establishes a standard you can use to map future processes.
When deciding which process to map first, consider the following factors:
Production impact
Safety and compliance impact
The level of inefficiency in the process
The cost of inefficiencies in the process
The process with the greatest impact across these areas is a good place to start.
In maintenance environments, these highest-impact workflows are typically related to work order or preventive maintenance management.
Once you’ve chosen the mapping processprocess to map, don’t overcomplicate it.
Your first version can be simple, just like the one you see below:
Source: California State University
Even a basic workflow diagram is often enough for onboarding and ensuring consistent execution.
However, if your needs are more complex, you can gradually add more detail.
One Reddit user offers some valuable advice:
Source: Reddit
By tailoring the version to the audience, you ensure clarity without overwhelming anyone, yourself included.
At the same time, this approach allows you to build strong process mapping capabilities step by step, starting with one core process and gradually advancing to more detailed analysis across your operations.
Involve Cross-Functional Stakeholders
Maintenance doesn’t happen in isolation.
Your processes likely touch operations, procurement, engineering, finance, and other departments, with each group offering a unique perspective.
That’s why it’s important to include representatives from all groups that interact with the process you’re mapping out.
Otherwise, you miss the full picture.
Research from Panopto has already shown that nearly half of employee knowledge is unique.
Illustration: WorkTrek / Data: Panopto
By involving everyone in the mapping process, you tap into that unique knowledge, creating maps that accurately reflect each workflow, including hidden bottlenecks and dependencies.
After all, collaboration and communication are at the heart of any successful task.
Without it, efficiency plummets.
The 2023 Oak Engage study confirms this, showing that over a third of employees believe poor internal communication leads to excessive rework and wasted time.
Illustration: WorkTrek / Data: Oak Engage
That’s exactly what can happen if you don’t ask your colleagues for help: mistakes, extra revisions, and wasted time.
To ensure successful communication and cooperation, consider using collaboration platforms.
Many of these platforms offer features like digital whiteboards, where team members can brainstorm, provide feedback, and add comments, photos, videos, or drawings.
Source: Klaxoon
This is especially valuable if you’re working on your map with hybrid teams, as it enables everyone to contribute from anywhere.
In the end, when all teams collaborate, you gain a thorough understanding of the process from all relevant perspectives.
This makes your process maps that much more accurate, relevant, and actionable.
Use Your CMMS to Validate the Process Map
Asking your colleagues to help with process mapping is incredibly important, but so is grounding your findings in hard data.
Therefore, after mapping the process as perceived by the teams, compare those insights against actual system data from your CMMS.
Daniel Golub, Sales and Marketing Leader specializing in SaaS businesses, explains why CMMS solutions are such a valuable source of truth:
Illustration: WorkTrek / Quote: MRO Magazine
Take our own CMMS, WorkTrek, for example.
It lets you log everything related to maintenance operations, including work requests and orders, PM schedules, completed tasks, spare parts, invoices, asset profiles, and more.
However, this isn’t just data for data’s sake.
Over time, this information builds a clear picture of your operations and highlights inefficiencies, making your process mapping more data-driven.
WorkTrek’s dashboard provides a brief overview of key insights, like open work orders, overdue tasks, on-time completions, and planned vs. actual expenses.
Source: WorkTrek
Additionally, if you’re interested in a deeper analysis, you can use our reporting feature to track metrics such as parts usage, backlog hours, PM schedule compliance, and take advantage of our reporting feature that tracks various metrics like parts usage, backlog hours, PM schedule compliance, and much, much more.
This data allows you to verify whether the documented process matches reality.
For instance, a WO process may seem smooth according to the team, but if the system shows numerous overdue WOs, something might be off, and you may need to investigate further.
Overall, bias in process mapping is nearly inevitable.
People often describe processes based on what should happen, what used to happen, or what they think happens.
With WorkTrek, however, you can see what actually happens, unlocking greater transparency than ever before.
Conclusion
Hopefully, it’s now clear that efficient maintenance processes don’t happen by accident or luck.
They are carefully mapped out, continuously monitored, and regularly refined to meet the company’s evolving needs.
It’s not that other teams have bigger budgets, more advanced equipment, or teams that are more hardworking.
No, they simply take the time to identify areas for improvement and address them.
That’s great news for you because it means you can achieve the same results.
It all starts with an accurate, thorough process map, developed collaboratively with all relevant teams and supported by real operational data.
Operations & Maintenance
6 Industrial Maintenance Trends Shaping the Industry
Key Takeaways:
Adopting energy management programs unlocks energy savings of about 11%.
Unscheduled downtime costs the world’s 500 biggest companies $1.4 trillion annually.
82% of companies say 3D printing helped them save costs.
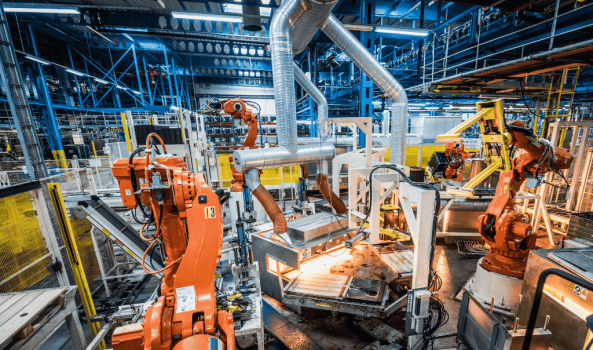
For decades, industrial maintenance teams followed a simple rule: wait until something breaks, then fix it.
Today, this is no longer sustainable.
Equipment failures can halt entire production lines, disrupt supply chains, and cost companies millions in lost productivity.
As factories become more connected, equipment grows more complex, and operational efficiency becomes increasingly critical, maintenance is evolving into a more strategic discipline.
As a result, various upkeep technologies and advanced tools are emerging, transforming how organizations maintain their assets and keep operations running.
In this article, we explore these and outline major trends shaping the future of industrial maintenance.
Increased Use of CMMS Solutions
Industrial maintenance has evolved far beyond clipboards, spreadsheets, and reactive repairs.
Today, Computerized Maintenance Management Systems (CMMS) have become the operational backbone of modern maintenance teams.
A good CMMS puts everything in one place, then keeps it both safe and accessible.
That means everything from preventive maintenance scheduling and work order management to spare parts tracking, asset histories, and performance analytics is handled within a single, unified platform.
With this information accessible in one place, teams can reduce manual coordination, respond faster to issues, and make decisions based on real operational data.
Automated reporting and KPI dashboards also give maintenance leaders a clearer view of overall asset performance.
Instead of guessing whether to repair or replace equipment, teams can analyze historical maintenance data, technician productivity, and asset reliability trends to guide decisions.
This visibility is vital in industrial environments, where downtime carries enormous financial consequences.
According to Siemens’ True Cost of Downtime 2024 report, unscheduled downtime costs the world’s 500 biggest companies $1.4 trillion annually, equal to 11% of their total revenues.
Illustration: WorkTrek / Data: Siemens
Reducing this risk requires a shift toward proactive maintenance strategies supported by digital tools.
Virve Viitanen, Head of Global Customer Care and Support at ABB’s Motion Services Division, agrees:
Illustration: WorkTrek / Quote: ABB
One platform helping industrial maintenance teams put this into practice is WorkTrek, a CMMS solution designed to elevate maintenance operations.
WorkTrek covers the full spectrum of maintenance needs, including:
Work order and request management
Preventive maintenance scheduling
Performance insights and analytics
Parts and inventory tracking
Compliance checklists
Asset management
Instead of stitching together spreadsheets and disconnected tools, maintenance teams gain a unified system for planning, executing, and analyzing maintenance work.
For instance, you can see WorkTrek’s dashboard below. It’s easy to navigate and offers an overview of the entire operation:
Source: WorkTrek
For companies managing complex industrial assets, the impact can be significant.
For example, InterEnergo, an energy company operating power and heating plants, previously managed asset information across spreadsheets and scattered documents.
This created a heavy reliance on individual employees for maintenance knowledge, sometimes leading to delayed servicing, plant shutdowns, and safety risks.
After implementing WorkTrek, however, the company centralized maintenance activities across its plants and equipment, giving teams complete visibility into asset performance and maintenance schedules.
Matjaž Valenčič, Operations & Maintenance Manager at interEnergo, explains:
Source: WorkTrek
The result was more reliable operations and a measurable return on investment.
This is what happens when organizations replace fragmented processes with a capable CMMS: they often see meaningful improvements in productivity and asset performance.
WorkTrek customers often report 35% increase in productivity, a 20% reduction in downtime, and a 15% extension of asset lifetimes.
These results directly strengthen the bottom line of industrial operations.
Additive Manufacturing for Spare Parts Management
Walk through a traditional industrial maintenance storeroom, and you’ll often see shelves stacked with spare parts that sit untouched for years, slowly losing value while tying up capital.
For decades, this stockpiling was accepted as a necessary cost of doing business.
Additive manufacturing, commonly known as 3D printing, is changing this entirely.
Instead of storing physical, large inventories of rarely used components “just in case,” companies can now maintain digital part files and produce replacement components “just in time” when needed.
This “digital inventory” approach enables maintenance teams to manufacture parts locally, reducing storage needs, shipping delays, and reliance on complex supply chains.
The operational benefits are significant.
Faster repairs help:
Improve asset availability
Reduce Mean Time to Repair (MTTR)
Enhance Overall Equipment Effectiveness (OEE)
Additionally, because printing can produce exact components, it also cuts assembly costs.
In fact, according to the Protolabs 2024 3D Printing Trend Report, which surveyed more than 700 engineers, designers, and manufacturers worldwide, 82% of respondents said 3D printing helped them save costs in their manufacturing pipeline.
Illustration: WorkTrek / Data: Proto Labs
In addition, 47% cited lead-time reduction as the primary reason they chose additive manufacturing over traditional production methods.
Another key advantage is the ability to keep aging equipment operational.
Components can be reverse-engineered and redesigned for older machinery, keeping legacy assets operational and extending return on investment without replacing entire systems.
Not to mention that additive manufacturing also supports sustainability by minimizing material waste, reducing carbon emissions from shipping, and enabling longer equipment lifespans.
Just ask Siemens Mobility.
At its RRX Rail Service Center in Dortmund, Germany, the company uses industrial 3D printing to produce replacement parts on demand.
Previously, manufacturing a customized component through traditional casting could take up to six weeks.
With additive manufacturing, the same part can now be produced in around 13 hours, reducing manufacturing time by up to 95%.
As Michael Kuczmik, Head of Additive Manufacturing at Siemens Mobility, explains:
Illustration: WorkTrek / Quote: Stratasys
Considering all the benefits, we’re likely to see this approach to spare parts management only grow from here.
IoT-Powered Condition Monitoring
For most of industrial history, maintenance has been a backward-looking discipline.
Teams responded to failures after they occurred or serviced equipment on fixed schedules regardless of its actual condition.
Yet, equipment failure remains one of the largest drivers of industrial downtime.
According to a Deloitte Industry 4.0 report, 42% of unplanned downtime is caused by equipment failure, costing manufacturers an estimated $50 billion annually.
Illustration: WorkTrek / Data: Deloitte
These figures clearly demonstrate that condition monitoring is no longer a nice-to-have but a non-negotiable operational imperative.
This is where IoT-powered condition monitoring comes in.
Sensors installed on industrial machines measure specific equipment parameters such as temperature, vibration, oil level, and frequency.
The data is transmitted to cloud-based platforms, where analytics tools transform raw sensor readings into actionable insights about equipment health.
Therefore, instead of relying on periodic inspections, maintenance teams gain continuous visibility into machine performance, enabling them to detect anomalies long before they escalate into failures.
In IoT networks, sensors form the foundation of predictive maintenance systems.
Different sensor types monitor specific failure indicators, including:
Accelerometers detect abnormal vibration in rotating machinery
Ultrasonic probes detect leaks in compressed air or steam systems
Thermocouples identify temperature anomalies in furnaces and motors
When readings move outside predefined thresholds, the system automatically triggers alerts.
This early warning allows maintenance teams to schedule repairs during planned downtime rather than responding to unexpected failures.
Another key advantage of IoT monitoring is accessibility.
Equipment data can be viewed in real time from virtually anywhere, enabling remote diagnostics and faster decision-making.
This capability is particularly valuable for industrial operations spanning multiple facilities or assets located in hazardous or difficult-to-access environments.
Jan Loeb, CEO of Acorn Energy, a provider of remote monitoring and control systems, highlights the economic benefits of remote condition monitoring:
Illustration: WorkTrek / Quote: Discounting Cash Flows
Real-world implementations already demonstrate the impact of these technologies.
At Volkswagen Wolfsburg's vehicle assembly plant, engineers deployed an Industrial IoT predictive maintenance system that combines machine sensors, edge computing, and advanced analytics to monitor the condition of production equipment.
The results have been substantial:
42% reduction in unplanned downtime
$47 million in annual cost savings
35% reduction in spare parts inventories
18% longer equipment life
A full return on investment in just seven months
It’s clear proof of how real-time condition monitoring can completely transform maintenance processes and unlock significant benefits.
The Rise of Predictive Maintenance
Condition monitoring shows what’s happening inside your equipment now, while predictive maintenance (PdM) forecasts what’s likely to happen next.
PdM leverages historical and real-time data, AI, machine learning, and IoT sensors to predict the optimal maintenance window, minimizing unplanned downtime.
The technology stack behind PdM is closely tied to IoT.
Sensors embedded in industrial assets continuously collect operational data, including vibration, temperature, pressure, and electrical load.
Advanced analytics platforms then process this data to identify patterns, detect anomalies, and forecast potential failures.
When anomalies are detected, like abnormal motor current or irregular bearing vibration, the system alerts maintenance teams before a breakdown occurs.
In practical terms, PdM allows maintenance teams to repair and replace components when needed, rather than performing unnecessary scheduled maintenance or reacting to unexpected breakdowns.
Predictive maintenance delivers several major operational benefits:
Lower maintenance costs, by avoiding unnecessary servicing
Reduced unplanned downtime, since failures are identified before they occur
Extended equipment lifespan, because components are replaced at optimal intervals
Improved asset utilization, enabling machines to operate closer to peak performance
Deloitte research shows that predictive maintenance programs can reduce maintenance costs by up to 10% while cutting maintenance planning time by up to 50%.
Illustration: WorkTrek / Data: Deloitte
PdM complements IoT-powered condition monitoring by turning real-time visibility into actionable failure predictions and maintenance recommendations.
Take, for instance, Owens Corning’s Tessenderlo Plant, a manufacturing facility specializing in FOAMGLAS® cellular glass insulation for building and industrial applications
In February 2024, their PdM system flagged a temperature spike on a 40-year-old ball mill.
As a result, technicians identified a cracked shaft, a damaged bearing shell, and lubrication issues early enough to accommodate a 17-week parts lead time.
In other words, the system prevented an unplanned shutdown, saving over $11.2 million in potential production losses, repair costs, and downtime.
Jelle Willems, Reliability Engineer at Owens Corning, commented:
“Instead of reacting to a crisis, we integrate repairs into our existing maintenance schedule — often preventing a complete shutdown. Before using [PdM], we relied on periodic inspections and manual lubrication. Unplanned downtime caught us off guard far too often, [...].”
That’s the power of predictive maintenance.
It helps you avoid the risk of under- and over-maintenance, keeping your assets in perfect condition for much longer.
Increased Use of AR in Training
Walk into most industrial facilities today, and you’ll still find technicians working from thick printed manuals, crouching next to machinery while trying to mentally map a two-dimensional diagram into a three-dimensional piece of equipment.
It’s slow, error-prone, and increasingly inadequate as machines grow more complex and experienced workers retire faster than they can be replaced.
As Hillary Ashton, Executive Vice President and General Manager of Augmented Reality at PTC, a global software company providing platforms and solutions, observes:
Illustration: WorkTrek / Quote: PTC
Augmented Reality (AR) is emerging as a practical solution.
By overlaying digital instructions, diagrams, and guidance directly onto physical equipment via smart glasses, tablets, or mobile devices, AR helps technicians understand complex machinery and follow procedures with precision.
Instead of flipping through paper manuals or static PDFs, technicians can now view step-by-step instructions precisely where and when they need them.
Interactive 3D content and annotations reduce interpretation errors and accelerate training progression.
One of AR’s primary advantages is improved efficiency and knowledge retention.
Traditional maintenance training often requires new hires to shadow experienced technicians or memorize manuals before working independently.
With AR, learners receive in-context guidance at their own pace, speeding onboarding and reducing reliance on experts.
Peer-reviewed research published in the CIRP Journal of Manufacturing Science and Technology found that AR-based training enhances knowledge acquisition by around 18-25%, compared with traditional paper-based methods.
Illustration: WorkTrek / Data: ScienceDirect
AR also enhances overall maintenance efficiency and safety.
By integrating AR with equipment schematics and digital twin models, technicians can visualize internal machine components, identify parts instantly, and follow real-time guidance without taking their eyes off their work.
This reduces errors, rework, and safety risks.
That’s why AR training is increasingly adopted across industries with complex equipment and strict safety standards.
By transforming static manuals into interactive, immersive experiences, AR helps companies boost both efficiency and safety while closing skills gaps in an increasingly technical workforce.
Focus on Sustainable Maintenance
Sustainability has reshaped expectations across every function of industrial operations, and maintenance is no exception.
For a long time, the sustainability conversation focused primarily on new builds, including greener facilities, renewable energy installations, and net-zero construction.
Today, attention is turning to what happens inside existing operations every day.
Sustainable maintenance goes beyond environmentally friendly upkeep of assets.
It also aims to eliminate wasteful practices, reduce costs, and minimize the social and environmental impacts of operations throughout the asset lifecycle.
Traditional maintenance strategies focus primarily on reliability and uptime.
Sustainable maintenance expands that by examining how maintenance activities influence energy consumption, emissions, waste generation, and resource use.
For example, maintenance teams may assess whether repairing an asset, replacing it with a more efficient alternative, or adjusting maintenance intervals produces the lowest environmental and operational impact over time.
While the scope is broader than many teams initially expect, sustainable maintenance typically focuses on three key dimensions:
Maintenance cycle efficiency and how the impact of repeated maintenance tasks compounds over time
Environmental footprint of maintenance materials, including lubricants, solvents, and replacement parts
Energy consumption and emissions generated by maintenance activities
It’s tempting to view sustainable maintenance primarily as a regulatory requirement.
However, that framing misses the larger opportunity.
When maintenance strategies align with efficiency goals, organizations often achieve simultaneous improvements in environmental, operational, and financial performance.
Energy savings are one clear example.
An analysis by the International Energy Agency (IEA) of more than 300 energy management case studies across 40 countries confirms this.
It found that companies implementing structured energy management programs achieved an average energy savings of about 11% in the first year.
Illustration: WorkTrek / Data: IEA
That’s because well-maintained equipment operates more efficiently, consuming less energy and producing fewer emissions.
Sustainable maintenance also reduces waste across maintenance operations.
Preventive maintenance extends equipment life, minimizes unnecessary component replacements, and reduces the amount of materials entering the waste stream.
Extending asset lifespan is one of the most powerful sustainability strategies available to maintenance teams.
Properly maintained equipment can operate for significantly longer periods, reducing the need for new manufacturing, transportation, and installation of replacement machinery.
Beyond operational improvements, sustainable maintenance also strengthens corporate sustainability initiatives and ESG performance.
This means that organizations that adopt greener maintenance practices often see improved brand reputation, stronger stakeholder trust, and greater alignment with sustainability goals.
Conclusion
Industrial maintenance is undergoing a profound transformation.
What was once viewed as a reactive function has evolved into a strategic discipline powered by data, connectivity, and advanced technologies.
Today, maintenance strategies are designed not just to keep machines running, but to optimize performance, reduce costs, and future-proof operations.
Organizations that embrace smarter, more proactive, and more integrated maintenance strategies will gain far more than operational reliability.
They’ll unlock measurable advantages in efficiency, safety, sustainability, and workforce productivity.
The future of industrial maintenance belongs to organizations willing to rethink how they manage and maintain their assets.
Those who embrace this mindset today will be better positioned to build more resilient, efficient, and sustainable operations for the years ahead.

Operations & Maintenance
What Is Industrial Maintenance?
Key Takeaways:
The industrial maintenance services market is projected to grow to $85.5 billion by 2031.
Manufacturing businesses lose approximately $225 million due to downtime.
The total cost of work-related injuries reached $176.5 billion in 2023.
77% of employees say AI has increased their workloads.
In this article, you’ll learn everything you need to know about industrial maintenance, including its role in successful business operations, its current challenges, and how to overcome them.
At first glance, industrial maintenance may seem like nothing more than a cost center.
For many, it’s a necessary evil that offers very little value beyond simply repairing broken machines.
However, as you’ll discover while reading this article, this couldn’t be further from the truth.
Industrial maintenance is, in fact, a cornerstone of operational efficiency, workplace safety, and long-term profitability.
Read on to find out more.
What is Industrial Maintenance?
Industrial maintenance is the process of inspecting, servicing, and improving equipment and systems to ensure an industrial facility operates efficiently and safely.
All sorts of industries that produce goods, such as manufacturing, mining, construction, and utilities, rely on this type of upkeep to maintain operational stability and achieve their performance targets.
It’s also important to note that industrial maintenance teams aren’t only responsible for the assembly line, but for all operational environments within a facility.
For example:
LogisticsMaintaining conveyor systems, automated storage and retrieval systems (AS/RS), forklifts, and barcode scannersUtilitiesTesting, inspecting, and performing upkeep on pumps, transformers, and HVAC systems to ensure continuous access to electricity and other servicesEnergy facilitiesMonitoring and servicing control panels, steam or cogeneration systems, and solar panels
In short, industrial technicians carry significant responsibilities and are vital to maintaining smooth and safe operations.
And as machinery and facilities become more advanced and complex, their role continues to evolve alongside them.
In fact, according to data from Allied Market Research, the global industrial maintenance services market is projected to grow from $49 billion in 2021 to $85.5 billion by 2031.
Illustration: WorkTrek / Data: Allied Market Research
As machinery advances, facilities expand, and end-user demand increases, organizations need With machinery advancing, facilities expanding, and end-user demand increasing, organizations are in need of highly skilled maintenance professionals more than ever before.
Those without in-house expertise have no choice but to turn to outsourcing to fill the gap.
Because, when it comes to industrial maintenance, there’s simply no room for cutting corners.
Why Regular Maintenance Matters in Industrial Settings
We’ve established that industrial maintenance is extremely important, but we haven’t yet answered why.
In the following sections, you’ll learn all about the benefits of regular upkeep within industrial environments.
Reduces Unplanned Downtime
Regular asset inspection and servicing help detect wear, misalignment, and minor defects before they escalate into major failures that can disrupt entire operations.
There is no more effective defense against the number one enemy of industrial environments: unplanned downtime.
Unplanned downtime is one of the most costly and disruptive challenges in industrial operations, sometimes costing companies millions of dollars per incident.
For example, research from Splunk shows that manufacturing businesses lose approximately $255 million due to downtime.
Illustration: WorkTrek / Data: Splunk
These immense losses occur because downtime affects multiple areas at once, from regulatory or SLA penalties and lost revenue to damage control expenses and overtime wages.
That’s why companies are investing heavily in various proactive maintenance strategies to address this costly issue.
Some are implementing advanced condition-monitoring technologies to optimize their schedules, while others are upgrading outdated systems that require excessive maintenance.
And some organizations, like Malaysia-based oil and gas company PETRONAS, are turning to predictive maintenance to reduce downtime.
In 2020, PETRONAS deployed a predictive maintenance system that monitors asset conditions and provides early warning alerts and diagnostics of issues days, weeks, or even months before failure.
Azizol Kamaruddin, Principal of Rotating Equipment at PETRONAS, praised the new system:
“[The predictive maintenance system] prescribes the corrective actions each time anomalies are triggered. This eliminates the need for manual, time-consuming investigations, and decisions can be made quickly, which in turn, boosts productivity.”
The results of this new maintenance approach have been truly impressive.
For instance, an instrumentation fault was detected that caused a restriction in a liquid separator, saving PETRONAS approximately $222,000 in potential asset failure and wasted materials.
It’s clear proof that, with the right maintenance strategy, downtime isn’t as much of a concern as it once wasdoesn’t have as big a concern as it once used to be.
Keeps Workers Safe
Machines that operate smoothly and predictably are far less likely to cause serious accidents or injuries.
This is particularly important in industrial environments, where heavy machinery, high voltages, hazardous materials, and extreme temperatures can create significant safety risks.
A 2018 incident involving a Lithuanian roll-on/roll-off (ro-ro) cargo ship illustrates how poor maintenance can easily escalate into disaster.
It all began with a single faulty component that caused a catastrophic engine failure, resulting in structural engine damage and a fire in the engine room.
The vessel’s third engineer, who was on duty at the time, suffered serious smoke-related injuries to his lungs, kidneys, and eyes while escaping.
Source: Nautilus International
It was later discovered that the engine’s connecting rods had not been maintained in accordance with the manufacturer’s instructions, which was the cause of this terrible incident.
This lesson here is quite clear.
Proactive maintenance spells the difference between smooth, routine operations and serious, potentially fatal accidents.
However, it’s also important to note that, beyond the paramount goal of protecting human life, strong upkeep/safety practices also shield companies from costly consequences.
These include high employee turnover, regulatory fines, and reputational damage.
The 2023 National Safety Council (NSC) provides more insight into the repercussions of preventable occupational injuries.
The total cost of work-related injuries that year reached $176.5 billion, averaging $1,080 per worker.
Additionally, these workplace injuries resulted in 70 million lost workdays, with the NSC estimating that an additional 55 million days will be lost in future years due to injuries that occurred that year.
Illustration: WorkTrek / Data: NCS
These figures show why safety must always be the top priority in industrial environments.
It’s vital not only for protecting workers but also for shielding operational stability, productivity, reputation, and the bottom line.
And it all starts with consistent, proactive maintenance of machinery and facilities.
Supports Regulatory Compliance
In addition to being reliable and safe, properly maintained machines are also compliant with all relevant laws and regulations.
Remember, industrial operations are governed by strict safety, environmental, and operational standards.
Regular maintenance, along with up-to-date maintenance logs, is key to meeting these requirements and avoiding severe penalties.
This is particularly true in highly regulated sectors such as food processing.
Feraas Alameh, the Market Segment Manager for Food & Beverage at Sherwin-Williams Protective & Marine, a leading supplier of protective coatings for industrial use, explains:
“A preventive maintenance plan which includes routine cleaning, equipment maintenance, and timely repairs helps to ensure all critical surfaces remain hygienic, slip-resistant, and compliant with food safety regulations.”
Overall, regulatory bodies have little sympathy for companies that put their workers, the public, or the environment at risk.
They will not hesitate to pursue legal action, which in some cases can result in mandatory shutdowns or the revocation of operating licenses.
Even so-called best-case scenarios, i.e., financial penalties, can be highly damaging.
For example, ProCon, a provider of paper sales and supply chain solutions for the North American paper printing and packaging industries, was fined $280,000 by OSHA in 2025.
That same year, Nova Chemicals, a major North American producer of plastics and chemicals, was fined $130,000 for safety violations following an incident that left a worker seriously injured.
Source: The Sarnia Journal
In both cases, investigators found deficiencies in maintenance training and documentation, including a lack of clear SOPs for machine operation and upkeep.
Unfortunately, many companies still treat maintenance purely as a cost center, failing to recognize that regular, carefully documented upkeep is not optional and carefully documented upkeep is not optional, but mandated by law.
It must be taken seriously at all times.
Those who neglect it risk severe fines and operational disruptions.
Those that prioritize it, however, gain a competitive advantage and build a reputation as reliable, safety-conscious organizations that care about their people and the environment.
The Biggest Challenges in Industrial Maintenance
Unfortunately, not every industrial company with a reliable maintenance team is able to unlock these benefits.
The industry is plagued by its own unique problems that cause inefficiencies, safety issues, and financial losses.
Here are some of the most common challenges, and how to address them.
Skills Gaps
Right now, the maintenance industry as a whole is experiencing significant challenges in finding skilled labor.
In fact, according to a survey by ABB, 43% of maintenance teams reported difficulties recruiting qualified staff in 2023.
Illustration: WorkTrek / Data: ABB
This shortage is driven by two main factors.
First, industrial machinery and operations are becoming increasingly complex and technology-driven.
This means that today’s workers need not only strong technical skills but also digital competencies to operate and maintain these advanced systems.
Unfortunately, professionals with this combination of skills are in short supply.
Second, the workforce is aging.
Igor Marinelli, CEO and Co-Founder of Tractian, an Industrial AI company specializing in predictive maintenance, explains:
Illustration: WorkTrek / Quote: PR Newswire
This poses a serious challenge for industrial environments, as it directly affects the quality of maintenance work.
A shortage of skilled workers often leads to rushed jobs, inefficient repairs, and mistakes that can cause greater long-term damage.
That’s why companies need to focus on retaining the employees they already have now more than ever.
Below, you’ll find worker retention strategies used by the US manufacturers, as reported by Deloitte.
Illustration: WorkTrek / Data: Deloitte
As you can see, the most effective tactics include strong benefits programs, flexible work arrangements, and ongoing training.
Essentially, employees want to see that their employers are willing to invest in them and treat themto be treated as the valuable assets they are.
As one executive interviewed by Deloitte put it:
“People who have been here for a long time and new hires are seeking a sense of belonging and being part of something bigger.”
Give them that sense of belonging through structured training, regular feedback, and genuine care for their well-being, and you’ll build a loyal workforce committed to the organization’s long-term success.
Transition to Predictive Maintenance
Currently, there’s a lot of talk about predictive maintenance and advanced technologies like IoT and AI, and how they can transform industrial operations or help address the skills gap.
Naturally, this sounds appealing to many executives who focus only on potential benefits but overlook the challenges.
The reality is that implementing predictive maintenance can be quite expensive, and most teams aren’t yet trained to handle the large volumes of data these predictive systems generate.
This likely explains why only 27% of industrial companies currently use predictive maintenance.
Illustration: WorkTrek / Data: MaintainX
Implementing it represents a significant and complex change: sensors must be installed properly, data compiled, cleaned, analyzed, and integrated into planning processes.
Each step demands specific skills, knowledge, and a budget. Companies that aren’t truly ready for this change risk deploying technology that can cause more harm than good.
In fact, Forbes research shows that in many cases, AI, a core component of predictive maintenance programs, has actually increased workloads and decreased productivity.
Many employees are frustrated, maintaining that their companies are asking too much of them when it comes to AI.
Illustration: WorkTrek / Data: Forbes
So, instead of rushing into the latest trends, it’s important to first assess your current processes and data maturity to determine whether your organization is ready for such a big shift.
This helps avoid wasted resources, highlights capability gaps, and ensures that when you do implement advanced technologies, you’re setting yourself up for success.
Outdated Processes
Speaking of maintenance maturity, the unfortunate reality is that many teams aren’t yet ready even for basic preventive programs, let alone advanced predictive maintenance.
The 2025 Zapium research confirms this, showing that many teams still rely on manual processes with no systematic way to track productivity, no PM schedules, and limited visibility into operations.
Illustration: WorkTrek / Data: Zapium
Such an outdated approach significantly slows down work, increases errors, and ultimately harms both asset reliability and operational efficiency.
Simply put, manual methods cannot keep pace with the demands of modern industrial companies.
For teams stuck in analogue mode, now is the perfect time to digitize maintenance operations and eliminate these inefficiencies.
No, this doesn’t mean jumping straight into the most advanced technologies.
There is a “golden middle” between manual work and fully advanced processes, and it’s called a Computerized Maintenance Management System (CMMS).
InterEnergo, a major international energy company headquartered in Slovenia, implemented this type of system, and it delivered impressive results.
Matjaž Valenčič, Operations & Maintenance Manager at interEnergo, explains:
Source: WorkTrek
CMMS solutions like WorkTrek serve as a central hub for all maintenance-related activities.
They automate work orders, preventive maintenance scheduling, spare parts tracking, invoicing, and more, ensuring that data is always accurate, up-to-date, and easily accessible.
This makes transitioning to proactive maintenance strategies much simpler.
Instead of assigning tasks by phone, planning work using spreadsheets, and manually tracking spare parts, supervisors can handle everything in one system.
They can create a work order using a template that includes SOPs and safety data, assign it to the right worker, and set a due date.
Source: WorkTrek
When the time comes, the worker receives a reminder and can access the work order on their phone, complete with all the information needed to perform the task efficiently and safely.
The bottom line is this: you don’t need the latest technology to achieve strong results in maintenance operations, but you also can’t afford to be held back by outdated processes.
CMMS solutions like WorkTrek are an efficient, user-friendly way to unlock significant productivity gains without overwhelming the team.
Conclusion
Hopefully, this article has given you a new appreciation for industrial maintenance and the technicians who perform this complex, dangerous, yet essential work every day.
Right now, it’s not easy to be in their shoes.
Numerous challenges are making their jobs more difficult than they should be, slowing them down, burning them out, and adding unnecessary stress.
At the same time, there has probably never been a more exciting time to be in this field, too.
A wide range of emerging technologies and tools, from predictive analytics to maintenance robots, are poised to transform the industry, making it more efficient and safer for everyone.
It will be exciting to see how the industry continues to evolve, especially as advanced technologies become more accessible and outdated processes are fully replaced.

Operations & Maintenance
Top 6 Maintenance Dispatch Software
Maintenance teams often face the same operational challenge: work requests arrive constantly, technicians are already in the field, and schedules change throughout the day.
Without a clear system, dispatching quickly becomes reactive and difficult to manage.
Maintenance dispatch software solves this problem by organizing requests, assigning work orders, and keeping technicians informed in real time.
The following six software are worth considering.
WorkTrek
WorkTrek is a cloud-based CMMS built to make maintenance management easier and more organized.
From the moment a work request comes in, you can see it in a central queue, review it, and turn it into a task or work order without juggling emails or spreadsheets.
Once tasks are created, the Scheduler gives you a clear visual timeline of all scheduled and unscheduled work, allowing you to assign, reassign, or reschedule jobs in seconds.
Source: WorkTrek
When new work appears, you simply drag the work order onto a technician’s calendar slot to assign it.
If priorities change during the day, you can move tasks between technicians or adjust the schedule in seconds.
Source: WorkTrek
This drag-and-drop approach is similar to scheduling tools in UpKeep and Limble CMMS.
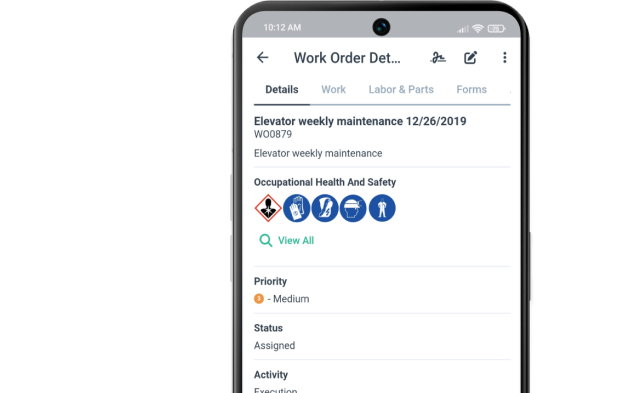
Each task can include instructions, checklists, photos, documentation, asset details, and hazard alerts, so technicians know exactly what to do and how to do it when they open it on their mobile phones.
Source: WorkTrek
Whether you’re scheduling preventive maintenance, inspections, cleaning, or troubleshooting failures, the system helps you ensure work is done safely and correctly.
Mobile notifications and multiple task views, like list, board, or map, help your team stay aligned, while the “Daily Summary” lets you see all completed work at a glance.
Moreover, the map view makes it easier to dispatch tasks based on location, allowing you to assign the nearest technician and reduce travel time.
Source: WorkTrek
Users often highlight the improved visibility and organization WorkTrek provides.
As Damir Fabijanković, Service Manager at METUS, a Croatian company specializing in the design, manufacturing, and maintenance of elevators and vertical transport equipment, notes:
“WorkTrek application helped us greatly in better visibility, control, and organization of work. With the WorkTrek mobile application, our technicians have a clearer division of work tasks, which improves their efficiency.”
Pricing is flexible to match your team’s needs.
The Starter plan begins at $29 per user per month and includes work orders, asset management, simple inventory, dashboards, and reports.
Professional adds preventive maintenance, service catalogs, advanced inventory, and subcontractor management for $49 per user per month.
Enterprise plans offer custom workflows, API access, and additional features on request.
All plans include unlimited guest requests and mobile access, making WorkTrek suitable for teams of any size.
BuildOps
If your maintenance operations are closely tied to commercial service work, such as HVAC, electrical, or mechanical contracting, BuildOps offers a broader operational platform that includes dispatching alongside:
CRM
Quoting
Scheduling
Invoicing
Reporting
The platform’s dispatch workflow revolves around its dispatch board, where you can view technicians, job assignments, and availability in real time.
Source: BuildOps
Unassigned jobs appear in a queue, allowing you to drag them directly onto a technician’s schedule.
While this interface resembles a scheduling system in WorkTrek, BuildOps adds another layer by helping you match technicians based on skills, certifications, and job history.
This skill-based dispatching can be especially useful when technicians specialize in specific equipment or systems.
Instead of manually checking qualifications, the system highlights which technicians are best suited for the job, helping improve first-time fix rates and reduce repeat visits.
https://www.youtube.com/watch?v=AgwimBfxi5I&t=1s
Source: BuildOps on YouTube
BuildOps also supports map-based dispatching, which lets you see technician locations in real time and assign nearby jobs when urgent service requests appear.
Any schedule changes made by dispatchers are instantly pushed to technicians through the mobile app, keeping field teams informed without constant phone calls.
Source: BuildOps
Despite these features, user opinions on the platform are mixed.
Reviews on G2 and Capterra often praise its comprehensive feature set and suitability for large commercial contractors.
However, some technicians on Reddit have reported occasional performance glitches and concerns about how dispatchers can adjust job timestamps after assignments.
Source: Reddit
BuildOps does not publish fixed pricing publicly, but based on buyer reports collected by Capterra, many organizations pay somewhere between under $55 and over $165 per user per month, depending on company size and configuration.
UpKeep
UpKeep is one of the most widely recognized maintenance management platforms and is commonly used by facility managers and maintenance teams transitioning from manual scheduling methods.
Dispatching in UpKeep happens through the Scheduler, where you can view technician schedules and unscheduled work orders in a single planning interface.
Source: UpKeep
When new tasks appear, you drag them from the unscheduled panel directly onto a technician’s calendar.
Source: UpKeep
The system allows you to filter work orders by asset, location, technician, or priority, making it easier to focus on the most urgent jobs.
The Scheduler also flags risks like double-booked technicians or overdue orders, giving supervisors a clear view of potential issues.
Source: UpKeep
Work orders themselves can include instructions, photos, manuals, and other documentation, similar to WorkTrek.
Technicians access these details through the mobile app, where they can update job status, log labor time, and add notes from the field.
Push notifications ensure technicians are alerted whenever new tasks are assigned or schedules change.
For more advanced dispatch planning, UpKeep offers UpKeep Studio, a web-only extension accessible to Administrators.
Studio includes apps like Work Order Routing & Dispatch, which let you plan routes with real-time map visibility, GPS-based start points, drive-time tracking, turn-by-turn navigation, and activity updates.
Source: UpKeep Studio
These apps leverage your existing UpKeep data to expand functionality, though they are currently only visible to the installing Administrator.
User reviews generally highlight the platform’s ease of setup and accessibility.
Many reviewers on G2 note that UpKeep helps teams quickly create maintenance schedules and process incoming work requests.
However, some users also mention that certain functions require customization and that performance may occasionally slow down when handling large datasets:
“The program requires a lot of customization, and it would be great if the customization options were more thorough. At times, the system crashes because of connectivity issues, and in those situations, it can be a bit slow to load information.”
Pricing starts at $20/user/month for the Essential plan, with Premium ($55) adding Studio access, PM scheduling, checklists, and parts tracking.
Higher tiers (Professional and Enterprise) offer mobile offline mode, advanced analytics, multi-site support, workflow automation, and API integrations.
Limble CMMS
Limble is a cloud-based CMMS that combines robust resource planning with full maintenance management.
Its Resource Planning feature allows you to schedule technicians, balance workloads, and ensure coverage for every work order or preventive maintenance (PM) task.
Source: Limble CMMS
You can set individual, team, or rotating schedules, account for exceptions like PTO or sick time, and assign tasks using drag-and-drop scheduling.
Source: Limble CMMS
Limble also supports smart time estimates and AI scheduling suggestions, which help consolidate tasks by location, type, or technician.
Source: Limble CMMS
However, keep in mind that once you apply the suggestion to your schedule, there’s no way to undo it.
Beyond scheduling, Limble handles the full maintenance workflow.
Work requests are centralized and can be converted into detailed work orders, which include checklists, photos, notes, parts, and tool requirements.
Technicians can access task information from mobile devices, while supervisors can track progress, missed work, and overall capacity through dashboards and reporting.
Users generally like Limble for improving task visibility, as this reviewer notes:
“I love being able to delegate to everyone from one platform without needing to have individual conversations about their tasks. All instructions, notes, parts and tools needed are right in the work order.”
Reported drawbacks include a non-native mobile interface, which can feel slower in the field, and the lack of built-in team chat.
Source: Reddit
Pricing begins with the Standard plan, including unlimited work orders, PMs, and assets.
Premium+ adds offline mobile access, spare parts tracking, and vendor management, while the Enterprise plan provides multi-location support, custom workflows, SSO, and system integrations.
Importantly, the Resource Planning feature is available only for Enterprise users.
Maintenance Care
For teams seeking a straightforward maintenance dispatch solution without extensive configuration, Maintenance Care offers a cloud-based system that organizes upkeep requests and work orders.
Dispatching is managed through a central work order dashboard, where you can review incoming requests, convert them into work orders, and assign them to technicians.
Source: Maintenance Care
As in all other software on this list, each work order can include asset information, due dates, attachments, and communication notes, giving technicians the details they need once the task is dispatched.
Technicians receive notifications when new work orders are assigned and can update task status directly from the mobile app.
This allows supervisors to track job progress without needing constant check-ins with the field team.
As with the other tools mentioned, Maintenance Care supports preventive maintenance scheduling, automatically generating recurring tasks for inspections or equipment servicing.
Source: Maintenance Care
These preventive work orders appear alongside reactive requests, allowing dispatchers to prioritize urgent issues while still keeping scheduled maintenance on track.
Compared with platforms like BuildOps or Limble CMMS, Maintenance Care focuses more on simplicity than advanced automation.
However, it still includes features such as inventory tracking, document storage, and reporting dashboards.
User opinions about the platform are mixed.
Some facility managers appreciate its simple interface and quick setup, while discussions on Reddit suggest teams needing more advanced automation sometimes move toward newer CMMS platforms.
Source: Reddit
When it comes to pricing, Maintenance Care offers a Free Edition with limited users and assets, while the Enterprise plan costs $225 per month and supports unlimited users and work orders.
A bundled plan with additional modules and integrations can reach $500 per month.
Coast
The last software on our list is Coast, designed for teams that want a simpler way to coordinate maintenance tasks and schedules without implementing a complex CMMS.
The platform combines work order management with communication and workforce coordination tools.
Dispatching is handled through its task and work order system, where you create jobs, set priorities, and assign them to technicians.
Source: Coast
Tasks can be scheduled as one-time assignments or recurring jobs for routine maintenance activities.
Once assigned, technicians receive notifications through the mobile app and can update task status as work progresses.
Compared with asset-heavy CMMS platforms like Limble CMMS or UpKeep, Coast focuses more on team coordination and daily operational visibility.
One notable feature is its built-in communication system, which allows technicians and supervisors to discuss maintenance issues directly within a task.
Source: Coast
Photos, comments, and updates remain attached to the work order, helping teams keep all relevant information in one place.
Coast also includes workforce management features such as shift swapping and time tracking.
Technicians can exchange shifts through the platform while managers review and approve requests.
Source: Coast
The integrated time clock helps track attendance, working hours, and overtime, providing better visibility into technician productivity.
User reviews on Capterra often highlight the platform’s ease of use and the ability to manage maintenance work across multiple sites without excessive complexity.
Some reviewers note that reporting tools are somewhat limited for executive-level analysis.
Source: Capterra
Coast offers a Free plan with basic task management features, while the Starter plan costs $20 per user per month.
The Pro plan costs $49 per user per month and adds reporting, automation, and customizable dashboards.
Enterprise plans are available for organizations requiring multi-site management and advanced integrations.
Conclusion
Overall, choosing the right maintenance dispatch software for you depends entirely on how your team organizes work in the field.
Some platforms focus mainly on scheduling and assigning work orders, while others combine dispatching with broader maintenance management capabilities.
Software like WorkTrek, BuildOps, and UpKeep provide robust dispatching alongside operational features, while solutions such as Coast prioritize simplicity and team coordination.
In the end, the best solution is the one that helps you assign work quickly, keep technicians informed, and ensure maintenance tasks are completed efficiently.

Operations & Maintenance
Equipment Criticality: A Quick Guide
Key Takeaways:
The world's 500 largest companies lose $1.4 trillion annually due to unplanned downtime — equal to 11% of total revenues.
Not all equipment carries the same risk. Criticality analysis helps you concentrate maintenance where it delivers the most value.
A structured criticality assessment covers two core factors: probability of failure and consequences of failure.
A CMMS like WorkTrek turns equipment criticality ratings into actionable, data-driven maintenance strategies that reduce downtime and cut operating costs.
Not all equipment is created equal. Some assets are mission-critical. Others can fail without halting production for more than an hour. The real challenge is knowing which is which and designing your maintenance strategy around that knowledge.
That is exactly what equipment criticality analysis helps you do.
This guide explains what equipment criticality is, why it matters, and how to perform a criticality analysis step by step. You will also learn how a modern CMMS like WorkTrek turns criticality data into smarter maintenance decisions.
What Is Equipment Criticality?
Equipment criticality refers to the relative importance of a piece of equipment to your operation's continued functioning. It is a measure of what happens when that asset fails, and how severe the impact is, and how likely it is to occur.
A high-criticality asset is one whose failure causes significant losses: production downtime, safety hazards, environmental damage, or steep repair costs.
A low-criticality asset, by contrast, can fail with minimal operational impact.
Source: WorkTrek
Assigning a criticality ranking to every asset allows maintenance managers to allocate resources where they matter most. Without a clear ranking, maintenance teams risk spreading efforts too thin and end up overmaintaining low-risk assets while neglecting the critical ones.
Why Equipment Criticality Matters
The impact of equipment failure extends far beyond a single broken machine. According to a 2024 Siemens report, unplanned downtime costs the world's 500 largest companies $1.4 trillion annually. That equals 11% of total revenues.
In the automotive sector alone, one idle production line costs up to $2.3 million per hour. In heavy industry, the figure reaches $59 million per hour.
These are extreme examples. But the lesson applies to facilities of every size. Unplanned downtime drains budgets, disrupts production schedules, harms product quality, and erodes customer trust. When equipment fails unexpectedly, the ripple effects are rarely contained.
Source: WorkTrek
Equipment criticality assessment helps you get ahead of these consequences. By identifying your most critical assets and applying the right maintenance strategy to each, you reduce the risk of failure for the equipment carrying the highest operational risk.
Research from ABB's Value of Reliability report, which surveyed more than 3,200 global plant maintenance leaders, found that two-thirds of industrial companies cite unplanned downtime as one of their biggest operational challenges.
Those that address it through structured maintenance planning consistently outperform those that do not.
What Does an Equipment Criticality Assessment Evaluate?
An equipment criticality assessment evaluates each asset based on two core factors.
1. Probability of failure
How likely is this piece of equipment to fail within a given period? Historical maintenance data, failure records, and expert judgment all inform this score. Assets that run continuously under harsh conditions carry a higher probability of failure than those used intermittently.
2. Consequences of failure
If this asset fails, what happens? The evaluation process looks at several areas:
Production losses and downtime duration
Safety implications for maintenance personnel and plant workers
Environmental impact and potential regulatory penalties
Repair costs and spare parts availability
Impact on product quality and customer commitments
Source: WorkTrek
These two factors are typically plotted on a risk matrix. Assets that score high on both axes receive the highest criticality ranking and become the focus of the most intensive maintenance tasks and monitoring programs.
How to Perform a Criticality Analysis: Step by Step
Step 1: Assemble a Cross-Functional Team
Do not limit the assessment to maintenance personnel alone. The process benefits from input across operations, safety, procurement, and finance. Each department experiences equipment failure differently.
Broadening the team prevents blind spots and produces more accurate criticality rankings. Operations knows which equipment directly throttles production output. Safety knows which assets create the greatest hazard exposure. Finance understands the full cost impact of downtime.
Step 2: Define Your Risk Matrix
Your team must agree on a consistent scoring framework before evaluating any asset.
Define what constitutes a major consequence versus a minor one. Establish clear probability ratings. These definitions must reflect your specific facility's context.
A common approach uses a 1-to-5 scale for both factors. A score of 5 represents the most severe consequence or the highest probability of failure. Multiply the two scores to produce a criticality number.
For example:
Consequence score: 5 (plant-wide downtime for 24+ hours)
Probability score: 4 (likely to fail within the year)
Criticality number: 20 (high risk, top priority for intensive maintenance)
Step 3: Identify the Assets to Evaluate
Focus on your most important assets first.
Many organizations recommend beginning with the top 10% to 20% of their total asset base. Trying to evaluate every component at once becomes unmanageable and delays results.
Source: WorkTrek
Start with production-critical equipment, safety-related systems, and assets with a known failure history. These are the equipment items most likely to carry a high criticality ranking.
Step 4: Gather Historical Maintenance Data
Pull records from your maintenance management system. Review work order history, failure modes, repair costs, and downtime frequency.
This historical maintenance data removes subjectivity from the evaluation process. Assets with frequent breakdowns, high repair costs, or long downtime durations are strong candidates for a higher criticality ranking.
Source: WorkTrek
Step 5: Score and Rank Each Asset
Using your risk matrix and the data collected, score each piece of equipment on both factors. Calculate the criticality number, then rank all assets from highest to lowest.
This priority ranking becomes your guide for allocating maintenance efforts, scheduling preventive maintenance tasks, and managing your spare parts inventory.
Step 6: Assign a Maintenance Strategy to Each Tier
Once your criticality ranking is in place, assign the appropriate maintenance strategy to each tier.
High-criticality assets warrant predictive maintenance, condition-based monitoring, and strict preventive maintenance schedules.
Medium-criticality assets can be managed with standard preventive maintenance programs.
Low-criticality assets may be candidates for run-to-failure maintenance, depending on their replacement cost and availability.
Source: WorkTrek
The goal is not to maintain everything equally. It is to concentrate maintenance activities on the assets that carry the greatest risk to continued operation.
Step 7: Review and Update Regularly
Equipment criticality is not static. A supplier discontinuing a critical spare part can raise an asset's criticality ranking overnight. New redundancies built into a production line can lower it.
Schedule regular reviews biannually to keep your criticality ratings current. Many organizations revisit them whenever a significant failure occurs or production layouts change.
Common Criticality Categories
Most criticality assessment frameworks use three to four tiers. Here is how they typically break down.
Critical (High) — Failure causes significant production losses, safety hazards, or major environmental impact. These assets demand the most intensive maintenance strategy, the tightest preventive maintenance schedules, and the most carefully managed spare parts inventory.
Source: WorkTrek
Essential (Medium-High) — Failure has a meaningful impact, but the business can absorb it for a short period. Consistent preventive maintenance is necessary.
Standard (Medium-Low) — Failure causes minor disruptions. These assets can tolerate a less intensive maintenance approach without significantly affecting operational efficiency.
Non-Critical (Low) — Failure has minimal impact on operations. These assets are often managed with a run-to-failure strategy as a deliberate choice to reduce operating costs.
How CMMS Supports Equipment Criticality
A structured criticality analysis is only as good as the data behind it and the system used to act on the results. That is where a CMMS becomes a valuable tool for any maintenance team.
WorkTrek is a modern CMMS platform built to make maintenance management smarter, more structured, and more data-driven. It supports every stage of the criticality analysis and helps teams act on the results consistently.
Centralized Historical Maintenance Data
A CMMS centralizes all maintenance records, work order histories, failure logs, and repair costs in one place. When assessing equipment criticality, managers can quickly pull accurate historical data. No need to piece together information from spreadsheets or outdated paper records.
Asset Management and Criticality Tracking
With a modern CMMS asset management module, you can create detailed profiles for every piece of equipment. These profiles store maintenance history, failure modes, and current condition. This makes it easy to record and track criticality scores directly within the platform.
Source: WorkTrek
Automated Preventive Maintenance Scheduling
Once your criticality rankings are set, a CMMS like WorkTrek can help you implement the right maintenance strategy.
The preventive maintenance tools allow you to automate task scheduling based on each asset's criticality tier. High-risk assets receive more frequent inspections and tighter intervals. Lower-risk assets are maintained appropriately without consuming excess resources.
Work Order Prioritization
Not all work orders carry the same urgency. A CMMS allows maintenance managers to prioritize tasks based on asset criticality. When equipment fails, the team immediately knows which repairs take precedence and which can be scheduled.
Source: WorkTrek
Spare Parts Inventory Management
For critical assets, having the right spare parts on hand can mean the difference between a two-hour repair and a two-day shutdown. WorkTrek's parts and inventory management feature tracks stock levels and alerts teams when critical components fall below minimum thresholds.
Performance Monitoring and Ongoing Improvement
Over time, WorkTrek captures the data needed to validate and refine criticality rankings. Managers can review failure frequency, repair costs, and downtime trends to determine whether current maintenance strategies are effective and, most importantly, adjust them if they are not.
CMMS enables faster, smarter decisions at every level of the maintenance operation. And when it comes to equipment criticality, that translates to fewer surprises, better resource allocation, and significantly less unplanned downtime for your most important assets.
Source: WorkTrek
According to a recent survey, teams using CMMS platforms report better visibility into completed work, reduced unplanned downtime, and improved team communication. All of this directly supports a more effective criticality-based maintenance strategy.
Equipment Criticality and Your Broader Maintenance Strategy
Equipment criticality assessment does not exist in isolation. It is the foundation of an effective maintenance strategy and a prerequisite for smarter maintenance planning.
Without it, teams end up in one of two traps: over-maintaining low-risk assets while neglecting critical ones, or applying the same maintenance frequency to everything regardless of risk. Both outcomes drain budgets and reduce overall maintenance efficiency.
Source: WorkTrek
With a solid criticality ranking in place, maintenance managers can make informed decisions about budget allocation, staffing, and scheduling. They can build a preventive maintenance program genuinely tied to operational risk, not just based on assumptions or outdated habits.
Conclusion
Equipment criticality is not a one-time exercise. It is an ongoing process that keeps your maintenance team focused on what matters most.
By identifying your most critical assets, understanding the potential consequences of failure, and applying the right maintenance approach to each tier, you reduce downtime, protect production, and make smarter use of limited resources.
Start with your top assets. Assemble a cross-functional team, define your scoring criteria, and build your risk matrix. Then use a CMMS like WorkTrek to act on your findings, track equipment performance over time, and keep your criticality rankings current as your operation evolves.
The difference between a reactive maintenance department and a proactive one often comes down to this: knowing which assets deserve your attention first.

Operations & Maintenance
What is the Equipment Criticality Assessment Matrix?
Key Takeaways
The equipment criticality assessment matrix helps maintenance teams rank assets by failure risk and operational impact.
Unplanned downtime costs Fortune 500 companies $1.4 trillion per year. Criticality analysis is one of the most effective tools to reduce it.
A structured criticality analysis process uses severity and probability scores to build a risk matrix for every piece of equipment.
CMMS platforms like WorkTrek make it easy to store criticality scores, automate preventive maintenance, and track critical assets.
Not all equipment is created equal. Some assets can fail without slowing production. Others can bring an entire facility to a halt in seconds.
The problem is that most maintenance teams treat every asset the same way. They schedule the same intervals, apply the same resources, and hope for the best. That approach wastes time, drains budgets, and leaves the most critical equipment exposed.
Source: WorkTrek
The equipment criticality assessment matrix fixes that.
It is designed to help maintenance managers rank every asset by its failure risk and business impact. That ranking drives smarter decisions about where to focus maintenance efforts, how to allocate resources, and which maintenance strategies to apply.
This article explains what the matrix is, why criticality analysis matters, how to build one, and how a CMMS like WorkTrek makes the entire process more effective.
📊 $1.4 Trillion lost annually to unplanned downtime by Fortune 500 companies— Siemens True Cost of Downtime 2024
What is Equipment Criticality?
Equipment criticality refers to the level of impact a piece of equipment has on safety, production, and business operations when it fails. A high-criticality asset is one in which an equipment failure causes serious and immediate consequences. A low-criticality asset can fail without a significant operational impact.
Source: WorkTrek
Asset criticality is not a fixed label. It is a calculated score based on several factors that your team evaluates together. Those factors typically include:
Safety risks to personnel and the environment if the equipment fails
Production impact and the extent of unplanned downtime caused by failure
Repair costs and replacement costs associated with the asset
Spare parts inventory availability and lead times for critical components
Regulatory compliance requirements tied to the equipment
Age and condition based on historical maintenance data and failure records
Failure frequency using maintenance history and mean time between failures
Understanding asset criticality gives maintenance teams a foundation for every decision they make.
It gives them a map as to where to look first when resources are limited and which preventive maintenance tasks cannot be deferred.
What is the Equipment Criticality Assessment Matrix?
The equipment criticality assessment matrix is a structured grid that maps every asset in your facility according to two dimensions: the severity of failure consequences and the probability of failure.
When you plot these two values against each other, you get a criticality score for every asset. That score determines the criticality level and tells your maintenance team exactly how to prioritize maintenance tasks and allocate resources.
The matrix is not just a spreadsheet exercise.
It is the underlying foundation of a data-driven maintenance program.
It connects asset-criticality analysis to your maintenance strategies, preventive maintenance schedules, spare parts inventory decisions, and overall resource allocation.
The Risk Matrix: How It Works
The criticality matrix uses a simple scoring system. Each asset gets a severity rating and a probability rating. Multiplying the two produces a risk priority number. That number places the asset in a criticality tier.
Here is a standard 4x4 equipment criticality assessment matrix:
Source: WorkTrek
Illustration: WorkTrek | Equipment Criticality Assessment Matrix (Severity × Probability)
Assets in the red zone need immediate attention.
They carry high criticality and require proactive maintenance strategies such as predictive maintenance or reliability-centered maintenance. Assets in the green zone can be managed with basic scheduled maintenance or a run-to-failure approach.
Source: WorkTrek
Why Criticality Analysis Matters
Maintenance teams are under constant pressure to do more with less.
A 2024 MaintainX report found that 45% of maintenance leaders cite a lack of resources as their biggest challenge. At the same time, 69% of plants experience unplanned downtime at least once a month.
Criticality analysis helps solve both problems. It tells maintenance teams where to focus their efforts so resources go to the assets that matter most. It also reduces the risk of critical failures by ensuring that high-criticality equipment receives the right level of attention.
Without a criticality assessment, maintenance is reactive by default. Teams respond to whatever breaks first rather than protecting what is most important. That approach costs far more in the long run.
Industry Data: According to Siemens' True Cost of Downtime 2024, the average large manufacturing plant loses $253 million per year to unplanned downtime. The average hourly cost per incident now exceeds $25,000 for most facilities and can reach $2.3 million per hour in automotive manufacturing.
A structured criticality analysis process prevents that cost by directing preventive maintenance tasks to the equipment that actually needs them. Less critical equipment gets appropriate maintenance strategies. Most critical equipment gets the protection it deserves.
Criticality analysis also supports reliability-centered maintenance (RCM) and overall asset management programs. It gives maintenance teams a common language for prioritizing work orders, allocating budget, and making capital investment decisions.
How to Conduct a Criticality Analysis: Step by Step
Performing criticality analysis does not require advanced software or months of data collection. It requires a structured approach, a cross-functional team, and honest input from the people who know the equipment best.
Source: WorkTrek
Who Should Be on the Cross-Functional Team?
The best criticality assessments include input from multiple departments. Maintenance personnel bring knowledge of failure modes and repair history. Operations managers understand production impact. Safety officers flag safety risks. Engineers provide technical insight into failure probability.
Assessing equipment criticality as a team reduces subjectivity and ensures that criticality scores reflect real operational priorities rather than individual assumptions.
What Data Do You Need?
The most reliable criticality scores come from real data.
Pull maintenance records and work order history from your CMMS. Review failure events and patterns. Check repair costs and replacement costs. Look at spare parts lead times.
If historical maintenance data is limited, use expert judgment as a starting point. Then refine the scores as you collect more information over time.
Factors That Affect Criticality Scores
Every organization defines its own criteria. But most criticality assessments evaluate the same core categories. Here is how each factor shapes the final criticality ranking:
Source: WorkTrek
Once you assign scores across all categories, you add or multiply them to produce a composite criticality score for each asset. Many teams use a weighted system to emphasize the factors most relevant to their operations.
Matching Criticality Levels to Maintenance Strategies
The criticality analysis process is only valuable if it changes how you maintain equipment. Different criticality levels demand different maintenance strategies. Here is how to match them:
Critical Equipment (Score 12 to 16)
High-criticality equipment receives the most intensive attention. Apply predictive maintenance using real-time condition monitoring. Add redundancy where possible. Schedule frequent inspections and ensure critical spare parts are always in stock. Never defer maintenance on these assets.
High Criticality Equipment (Score 8 to 11)
These assets need strong preventive maintenance programs with clearly defined intervals. Use condition monitoring to catch early signs of degradation. Build your maintenance schedule around these assets and do not let work orders slip.
Medium Criticality Equipment (Score 4 to 7)
Schedule regular preventive maintenance tasks based on manufacturer recommendations and usage data. Monitor performance trends, but do not over-invest in redundancy or advanced monitoring tools.
Less Critical Equipment (Score 1 to 3)
Run-to-failure or time-based maintenance intervals are acceptable. Revisit these assets periodically to confirm that their low criticality rating remains accurate. Operational conditions change over time.
Common Mistakes When Assessing Equipment Criticality
Many maintenance teams run into the same problems when they first conduct a criticality analysis. Knowing these pitfalls in advance helps you avoid them.
Scoring based on opinion rather than data. Pull maintenance records and failure history before assigning criticality scores. Gut feel leads to inconsistent rankings.
Including only maintenance personnel. A cross-functional team produces more accurate scores. Operations, safety, and engineering all have relevant perspectives.
Treating the matrix as a one-time exercise. Equipment conditions change. New assets get added. Failure modes evolve. Review and update criticality scores at least annually.
Ignoring failure modes entirely. Identifying failure modes for each asset makes the probability scoring more accurate and the maintenance strategy more targeted.
Skipping the connection to maintenance planning. A criticality matrix that does not change maintenance schedules or resource allocation provides no value. The output must drive real decisions.
How a CMMS Supports Criticality Analysis
Running a criticality analysis manually is possible, but it is slow and prone to error. A CMMS makes the entire process faster, more accurate, and more actionable. Here is how it helps at each stage.
CMMS CapabilityHow It Supports Criticality AnalysisAsset RegisterStore criticality scores, failure history, and condition data for every asset in a central location.Work Order ManagementAutomatically prioritize work orders based on asset criticality. High criticality equipment generates urgent orders.Preventive Maintenance SchedulingBuild maintenance schedules tied to each criticality level. Critical assets get frequent, automated PM triggers.Maintenance RecordsHistorical maintenance data feeds directly into probability scoring for future criticality reviews.Spare Parts InventoryTrack critical spare parts by asset. Ensure high criticality equipment always has the parts it needs available.Reporting and AnalyticsMonitor equipment performance trends and KPIs like MTTR and MTBF to refine criticality scores over time.
A 2024 UpKeep survey found that 65% of companies now use a CMMS to manage maintenance activities. Teams using CMMS platforms report fewer unplanned downtime events, better visibility into completed work, and stronger communication across maintenance teams.
Source: WorkTrek
Conclusion
The equipment criticality assessment matrix is one of the most practical tools in maintenance management.
It brings structure to a process that often relies on instinct. It tells maintenance teams exactly where to focus, which assets need the most protection, and which maintenance strategies will deliver the best results.
The data is clear. Unplanned downtime is expensive, disruptive, and largely preventable. A structured criticality analysis process helps maintenance managers stay ahead of critical failures rather than reacting to them after the damage is done.
The next step is to put it into practice. Start with your most critical assets. Assemble a cross-functional team. Use your CMMS to gather the historical maintenance data you need. Build your matrix. Then let the scores drive your maintenance plan.
If you need a CMMS that supports every step of that process, WorkTrek is ready to help.

Operations & Maintenance
5 Common Industrial Maintenance Mistakes
Key Takeaways:
Over two-thirds of industrial businesses face at least one unplanned outage each month.
Nearly 60% of organizations spend less than half of their maintenance time on scheduled preventive work.
A poorly installed set screw on a ship caused $2.2 million in damage in 2021.
How much money does your facility lose each year because of unplanned equipment downtime?
In most cases, the answer is: more than it should.
Many of these breakdowns stem from industrial maintenance mistakes that are easy to prevent once you know what to look for.
And that’s exactly why we’ve created this article.
If you’re a maintenance manager who wants to reduce costly failures and keep operations running smoothly, read on.
Relying Too Heavily on Reactive Maintenance
One of the most common mistakes in industrial maintenance is waiting for equipment to break down before doing anything about it.
Many organizations opt for this reactive approach over a preventive one because it seems cheaper in the short term.
After all, if you skip regularly scheduled maintenance, you save on labor, parts, and downtime costs right now.
The problem is that equipment does not fail on a convenient schedule. Instead, it tends to break down when you least expect it.
And when that happens, you face unplanned outages.
According to ABB's "Value of Reliability" survey, more than two-thirds of industrial businesses experience at least one unplanned outage every month.
And these outages are expensive.
Illustration: WorkTrek / Data: ABB
Despite this, the same survey found that 21% of businesses still use a run-to-failure maintenance strategy.
This means they intentionally let equipment operate until it stops working, and only then do they replace or repair it.
Although it carries significant risk, this strategy is still a conscious operational choice.
But without proper planning, many companies end up relying on even worse types of reactive maintenance, like emergency and breakdown maintenance.
These are unplanned responses to unexpected failures, leaving teams scrambling with no preparation at all.
Source: WorkTrek
With these types of maintenance, you are not just paying the price of lost production during the outage.
The cost of the actual repairs goes up, too, because you often need to order parts urgently, pay for overtime labor, or bring in outside specialists on short notice.
Consider the 2021 Atlantic Huron accident.
A poorly installed set screw caused a mechanical failure, resulting in 2.2 million USD in damage, with fortunately no injuries.
Source: NTSB
The ship's records showed the set screw was reinstalled over four years earlier without the manufacturer-required thread-locking fluid, which is meant to keep the screw from loosening over time.
Granted, we do not know whether that work was rushed or overdue.
But it raises a key question: if one improperly installed screw can cause this level of damage, why risk leaving maintenance to chance?
Ultimately, relying heavily on reactive maintenance increases the likelihood of these failures, and the consequences can go far beyond cost.
Inadequate Preventive Maintenance Planning
The obvious solution to the previous mistake is shifting your focus toward preventive maintenance.
However, a new problem often comes up here: not planning that shift properly.
Many organizations have a preventive maintenance strategy on paper, but either fail to execute it consistently or do not follow through at all.
Research from MaintainX illustrates this exact gap.
While the majority of organizations adopt this strategy, nearly 60% still allocate less than half of their maintenance time to scheduled preventive maintenance work.
Illustration: WorkTrek / Data: MaintainX
One reason for this is that teams fall back into reactive habits because of short-term cost savings.
Another common reason?
Building the maintenance plan on a weak foundation.
Some of the data points that can lead to over- or under-maintenance of equipment are illustrated below.
Source: WorkTrek
For example, consider a maintenance crew that rigidly follows manufacturer recommendations for servicing a piece of equipment.
If those intervals do not match the equipment's actual usage or wear patterns, you end up performing excessive maintenance and wasting resources.
On the other hand, heavily used equipment could be severely undermaintained if your schedule is based on assumptions or you lack historical performance data.
The bottom line is that, with a preventive approach, having accurate, accessible data is essential.
This is where a computerized maintenance management system (CMMS) like WorkTrek can help.
Tools like WorkTrek can automatically generate work orders based on different trigger types, including time-based, meter-based, or condition-based ones.
The meter-based option is especially useful because it allows you to schedule maintenance based on real equipment usage readings rather than guesswork.
Source: WorkTrek
For time-based schedules, WorkTrek automatically creates recurring work orders and sends notifications to technicians on their mobile devices, so nothing gets missed.
And because a CMMS centralizes your entire asset maintenance history, parts inventory, and scheduling data in one place, you have everything you need to plan an effective preventive strategy.
In short, while moving to preventive maintenance is the right direction, without proper planning and the right tools, the results can easily fall short of expectations.
Lack of Training
Even the best maintenance plan can fail if the technicians responsible for it lack the proper training to execute it.
Unfortunately, the maintenance industry faces a real challenge in finding skilled, well-trained workers.
According to MaintainX's 2024 State of Industrial Maintenance report, 60% of organizations identified skilled labor shortages as the leading challenge to improving their maintenance programs.
Illustration: WorkTrek / Data: MaintainX
The reason behind this is fairly obvious.
As older technicians retire or leave the workforce, there is simply not a strong enough pipeline of younger talent entering the field to replace them.
This problem keeps getting worse as more experienced maintenance technicians reach retirement age, explains remote staffing and marketing specialist Dan Trujillo:
Illustration: WorkTrek / Quote: MyOutDesk
Therefore, organizations failing to provide thorough training to workers entering this field can be considered a critical mistake.
Teams need structured training on your specific equipment, safety procedures, and maintenance workflows so they can work confidently and safely from the start.
Plus, with the complexity of existing machinery and the introduction of innovative new equipment into facilities, training is not optional.
Without it, technicians are more likely to make errors that lead to equipment damage, production delays, or serious injuries.
Luckily, there are various programs to support maintenance training.
For example, ATS offers both hands-on and online technical training courses designed to improve the skills of industrial maintenance technicians.
Source: ATS
However, it’s important to note that these general training programs should be coupled with equipment-specific training.
After all, every facility has its own machines with their own procedures, tolerances, and safety requirements.
And making sure technicians know how to properly service the exact equipment they work with every day is just as important as building their broader technical foundation.
The bottom line is this: equipment is only as reliable as the people maintaining it, so heavy investment in upskilling teams is crucial.
Not Following LOTO Procedures
Another common mistake, one which often stems from a lack of training, is failing to follow lockout/tagout (LOTO) procedures.
And if we look at recent data, LOTO violations have actually been on the rise.
For instance, the 2024 State of Electrical Safety Report by Grace Technologies reveals a 29% increase in LOTO citations between 2022 and 2023.
Illustration: WorkTrek / Data: Grace Technologies
The report further shows that the manufacturing industry has been disproportionately affected, with food manufacturing, fabricated metal products, and plastics and rubber products accounting for the majority of citations.
Unfortunately, this is also one of the most dangerous mistakes on our list, as it can cause serious injuries or even death.
OSHA regularly documents accidents of all kinds, including those related to LOTO failures.
These serve as important reminders of everything that can go wrong.
Let’s take a look at an example.
While performing maintenance on a baler, a maintenance supervisor was seriously injured while servicing the equipment without performing lockout/tagout.
Source: OSHA
In this case, the crew may have skipped LOTO because the product was piling up in the chute, and they wanted to resolve the issue quickly.
This is quite a common pattern.
Maintenance workers sometimes intentionally bypass LOTO procedures when they are in a rush, especially when equipment is down and causing production delays.
Some other common reasons behind LOTO violations are illustrated below.
Source: WorkTrek
Even when employees are properly trained and not under time pressure, routine maintenance work can lead to carelessness.
For example, a technician who has serviced the same machine dozens of times might start skipping verification steps simply because nothing has gone wrong before.
This is why regular safety inspections are so important: they help catch dangerous mistakes before they result in an accident.
Equally important, LOTO procedures need to be clearly written, easily accessible, and regularly revised to reflect changes in equipment or workflows.
Done right, well-documented and enforced LOTO programs are one of the most effective ways to protect maintenance crews from serious harm.
Poor Maintenance Documentation
The last mistake on our list today is one that many teams overlook: having poor maintenance documentation workflows.
Maintenance crews often skip or rush through documentation because they see it as extra paperwork that takes time away from actual repairs.
And it makes sense: after a long shift of fixing equipment, filling out detailed records is usually the last thing on anyone's mind.
But even when documentation does get completed, it often lacks the detail needed to be useful.
A proper maintenance work log should include elements like those shown in the image below.
Source: WorkTrek
Without these details, you lose the ability to spot patterns.
Let’s say a technician replaces a bearing on a conveyor, but does not log which bearing was used and what caused the failure.
In that case, your team has no way of identifying that the same bearing has failed four times in six months.
That’s a crucial indicator of a recurring issue that could point to a deeper alignment or lubrication problem costing you significant money in parts and downtime.
This documentation problem often stems from a lack of standardization across teams.
Some workers use paper logs or informal notes, while others track maintenance on spreadsheets that don’t sync to a centralized location.
As a result, information gets lost, duplicated, or stored in places where others cannot find it.
This is another scenario in which using a CMMS is the way to go.
These systems typically offer standardized work order forms with customizable fields, the ability to attach photos directly from a mobile device, and even structured drop-down menus that make it faster and easier for technicians to log their work consistently.
Source: WorkTrek
This means that, instead of writing vague notes, crews can quickly select failure codes, log parts used, and document findings in a format that is searchable and reportable.
However, as Ricky Smith, CMRP and VP of World Class Maintenance, points out, these benefits can only materialize if teams consistently input data into CMMS or enterprise asset management (EAM) systems.
Illustration: WorkTrek / Quote: Reliable
Establishing a digital documentation process only for teams to revert to handwritten notes or familiar spreadsheets defeats the purpose entirely.
Without consistent adoption, even the best CMMS becomes an expensive tool that sits unused while critical maintenance data continues to slip through the cracks.
Conclusion
That covers the five most common maintenance mistakes we see in industrial facilities.
We looked at the risks of relying solely on reactive maintenance rather than preventive maintenance, the importance of proper training and lockout/tagout procedures, and why good documentation matters more than most teams realize.
Take these ideas back to your team, review your current processes, and start closing the gaps.
After all, even small changes can lead to fewer breakdowns and a safer workplace.

Enterprise Asset Management
A Guide to Equipment Validation
Key Takeaways:
Equipment validation is a formal, documented process that confirms your equipment performs reliably and consistently within predefined acceptance criteria.
The validation process follows three core qualification stages: Installation Qualification (IQ), Operational Qualification (OQ), and Performance Qualification (PQ).
In 2024, the EMA conducted 210 GMP inspections for centrally authorized medicines, with 10 leading to non-compliance statements that blocked EU supply.
A CMMS like WorkTrek helps manufacturers maintain validated equipment, store documentation, and stay inspection-ready at all times.
Regulatory bodies do not accept good intentions as evidence of compliance. They want documented proof.
If your manufacturing equipment cannot demonstrate that it performs reliably, within specified operational parameters, and in accordance with predefined acceptance criteria, you are exposed to warning letters, costly recalls, and potential production shutdowns.
Equipment validation is the systematic process that provides proof. It is how regulated industries confirm that all the equipment involved in production processes meets the necessary quality standards before it is ever used to produce a finished product.
This guide covers everything you need to know.
From understanding what equipment validation is and why it matters, to the key phases, regulatory requirements, and how a CMMS can help your team maintain a validated state long after the initial qualification is complete.
What Is Equipment Validation?
Equipment validation is the process of collecting and evaluating documented evidence that a piece of equipment consistently performs as intended and in accordance with its manufacturer's specifications.
It is a core requirement under Good Manufacturing Practice (GMP) regulations and quality management systems such as ISO 13485 and ISO 9001. It also forms a central part of any validation master plan.
The goal is straightforward: ensure consistent quality across every production run. That means your pharmaceutical, laboratory, and analytical equipment, as well as critical instruments, all need to be verified and documented before they are used in regulated production processes.
Source: WorkTrek
Equipment validation is not a one-time event. It is an ongoing commitment.
Any time equipment is modified, relocated, or repaired, revalidation activities are required to confirm that the equipment still meets its critical equipment parameters.
Equipment validation is required when:
New equipment is installed and prepared for use
Existing equipment is modified or undergoes significant repairs
Manufacturing processes change or new raw materials are introduced
Periodic regulatory reviews or internal quality audits are triggered
Equipment fails or shows performance outside its operational parameters
Why Equipment Validation Matters
The consequences of skipping or poorly executing validation activities are severe.
In 2024, the EMA reported 210 GMP inspections for centrally authorized medicines, with 10 inspections leading to non-compliance statements. Those outcomes blocked EU supply for the affected products.
In the United States, the FDA cited a drug manufacturer in 2024 for failing to conduct adequate cleaning validation studies for multipurpose equipment and ordered the company to cease all manufacturing operations until the issue was resolved.
Source: WorkTrek
Beyond regulatory penalties, equipment that operates outside its validated state can compromise final product quality and, in pharmaceutical manufacturing and medical devices, directly threaten patient safety.
More than 60% of regulatory observations in pharmaceutical manufacturing relate to documentation control, investigation quality, and procedural compliance gaps. Robust equipment validation, properly documented, is one of the most direct ways to close those gaps.
Equipment validation matters because it protects three things at once: your patients, your products, and your business.
The Three Core Phases: IQ, OQ, PQ
The equipment qualification process follows a structured lifecycle. Each phase builds on the previous one and is supported by validation protocols, documented test procedures, and clear acceptance criteria.
1. Installation Qualification (IQ)
Installation qualification confirms that the equipment has been delivered, installed, and configured correctly in accordance with manufacturer specifications and user requirements.
During IQ, the validation team verifies that critical components are present and intact, that utilities are connected properly, and that the equipment installation matches the approved design specifications.
Source: WorkTrek
IQ documentation typically covers:
Equipment model, serial numbers, and delivery records
Confirmation against the manufacturer's specifications and functional specifications
Utility connections, including electrical, water, and gas
Instrument calibration records for critical instruments
Safety procedures and operator training requirements
2. Operational Qualification (OQ)
Operational qualification (OQ) confirms that the equipment operates as intended across its full range of operating procedures. The validation team runs the equipment through defined test conditions to verify that it consistently meets its operational parameters.
OQ challenges the equipment at the boundary conditions.
This means testing not just at typical operating settings, but at the upper and lower limits of the equipment's specified range to confirm it performs reliably throughout.
OQ activities include:
Verifying critical process parameters against predefined acceptance criteria
Testing alarm systems, interlocks, and safety controls
Confirming that standard operating procedures (SOPs) are adequate
Documenting all test procedures and deviations with corrective actions
3. Performance Qualification (PQ)
Performance qualification (PQ) is the final stage of the IQ OQ PQ sequence. It confirms that the equipment performs reliably under actual production conditions, using real materials and following approved operating procedures.
Source: WorkTrek
Where OQ tests the equipment in isolation, PQ tests it in context.
The equipment must demonstrate consistent quality output across multiple production runs, with results that meet predefined acceptance criteria every time.
Successful PQ completion means the equipment is formally in a validated state and cleared for use in regulated manufacturing processes.
Process Validation vs. Equipment Qualification
These two terms are closely related but address different things.
Equipment qualification, covering IQ, OQ, and PQ, focuses on the individual piece of equipment. It confirms that the equipment functions correctly, safely, and consistently within its operational parameters.
Process validation focuses on the entire manufacturing process.
It confirms that the production process as a whole reliably produces a high-quality product that meets its specifications. This includes evaluating raw materials, production parameters, and final product quality.
Illustration: WorkTrek / Data: Forbes
Both are required for full regulatory compliance. Equipment qualification provides the foundation. Process validation builds on top of it.
The FDA's guidance on Process Validation: General Principles and Practices outlines a three-stage lifecycle approach: process design, process qualification, and continued process verification. Each stage relies on validated equipment as a prerequisite.
Key Components of an Equipment Validation Protocol
A well-structured validation protocol is the foundation of every successful validation project. It serves as the official roadmap that the validation team follows from start to finish.
Every equipment validation protocol should include:
Scope and purpose: what the protocol covers and why it is being conducted
User requirement specifications (URS): what the end user needs the equipment to do
Functional specifications: how the equipment will achieve those requirements
Risk assessment: identifying critical components, critical process parameters, and failure modes
Test procedures: step-by-step instructions for each qualification activity
Predefined acceptance criteria: the measurable thresholds each test must meet to pass
Traceability matrix: mapping each requirement to a specific test
Documentation requirements: what records must be created and retained as documented evidence
Deviation procedures: how to handle results that fall outside acceptance criteria
Source: WorkTrek
Skipping any of these components creates gaps that inspectors will find. A complete, accurate protocol also makes future validation efforts faster because the framework is already in place.
Regulatory Requirements and Standards
Equipment validation guidelines vary by industry and geography, but the core expectations from regulatory bodies are consistent.
Key regulatory frameworks include:
FDA 21 CFR Parts 210 and 211: Good Manufacturing Practice regulations for pharmaceutical manufacturing in the United States
EU GMP Annex 15: The European Commission's guidelines on qualification and validation, covering the full equipment lifecycle
ISO 13485: Quality management systems requirements for medical devices, including equipment validation provisions
ICH Q9: Quality Risk Management guidance, which informs the risk assessment approach within validation activities
WHO TRS guidelines: World Health Organization technical reports that define validation expectations for global pharmaceutical manufacturing
Regulatory inspection readiness is one of the most practical drivers of consistent validation practice. Inspectors want to see documented evidence, not verbal assurances.
Source: WorkTrek
Data integrity is a particular area of focus. Every piece of documented evidence must be attributable, legible, contemporaneous, original, and accurate. These are the ALCOA principles that underpin any audit-ready quality system.
Equipment Validation Best Practices
Knowing the steps is not enough. Execution quality is what separates teams that pass inspections from those that do not.
1. Conduct a thorough risk assessment before starting.
Not all equipment carries the same level of risk. Critical equipment that directly creates a product or controls critical process parameters requires more rigorous validation than non-critical support equipment. Use a risk-based approach to prioritize your validation activities and allocate resources accordingly.
2. Build your traceability matrix early.
A traceability matrix connects every user requirement specification to a specific test. It confirms that nothing has been overlooked and that all the equipment functions intended by the user have been tested against predefined acceptance criteria.
3. Document everything in real time.
Documented evidence recorded after the fact raises questions about data integrity. Maintain maintenance records, calibration logs, and qualification reports as the work happens.
4. Train your validation team thoroughly.
The people executing validation protocols must have a thorough understanding of both the equipment and the regulatory requirements. A comprehensive qualification effort falls apart if the team executing it does not know what they are looking for. Focus on training your team.
5. Plan for revalidation from day one.
Validated equipment needs ongoing management. Build revalidation triggers into your operating procedures, including after maintenance, process changes, or equipment moves. This protects your validated state and supports continuous improvement.
How a CMMS Supports Equipment Validation
Most teams struggle with equipment validation, not because they lack knowledge, but because they lack the systems to manage it at scale.
Maintenance records get scattered. Calibration schedules are missed. Validation documents live in binders that no one can find during an inspection. These are not hypothetical problems. They are the most common reasons that facilities fail audits.
A Computerized Maintenance Management System (CMMS) directly addresses all of these issues.
Source: WorkTrek
Industries That Require Equipment Validation
Equipment validation is not exclusive to the pharmaceutical industry, though pharmaceutical equipment validation and pharmaceutical manufacturing remain the most visible context due to stringent FDA and EMA oversight.
Regulated industries that require formal validation include:
Pharmaceutical manufacturing: drug production, formulation, and packaging require validated equipment at every stage
Medical devices: ISO 13485 and FDA 21 CFR Part 820 mandate equipment qualification for device production
Biotechnology: production of biologics and cell-based therapies involves highly specialized, validated equipment
Food and beverage: equipment used in critical processing steps must meet safety and quality standards
Aerospace: equipment used to manufacture safety-critical components requires formal qualification
Laboratory and analytical equipment: any instrument used to generate data that informs product release decisions requires validation
Source: WorkTrek
In each of these sectors, the principle is the same: equipment that is not validated is a liability.
The level of formality and regulatory scrutiny varies, but the need for documented evidence that equipment performs reliably does not.
Common Pitfalls to Avoid
Even experienced teams make validation mistakes. Knowing where others have gone wrong helps you avoid the same problems.
The most common pitfalls include:
Incomplete user requirement specifications: when URS documents are vague, it becomes impossible to write meaningful acceptance criteria or test procedures
Poor change control: modifications to equipment or production processes without triggering revalidation are among the most cited deficiencies during inspections
Gaps in maintenance records: validation establishes a baseline, but if maintenance records do not demonstrate that the equipment has been kept in its qualified condition, that baseline becomes meaningless
Treating validation as a one-time project: equipment qualification is not a checkbox. It is a continuous quality management commitment
Relying on manual documentation: paper-based systems create data integrity risks and make inspection preparation extremely time-consuming
These pitfalls are not inevitable.
With the right maintenance strategy and the right tools in place, they are entirely preventable.
Source: WorkTrek
Conclusion
Equipment validation is a critical function in any regulated manufacturing environment. It confirms that your equipment performs reliably, that your production processes consistently deliver high-quality products, and that your organization can demonstrate compliance at any time.
The IQ OQ PQ framework gives you a structured, repeatable pathway from equipment installation to full production readiness. But the work does not stop at PQ sign-off.
Maintaining validated equipment requires ongoing discipline: regular calibration, documented maintenance records, and a clear process for managing changes.
Teams that treat validation as a continuous quality management activity, supported by strong systems and clear procedures, are the ones that pass inspections, avoid recalls, and consistently deliver safe, effective products to patients and customers.

Compliance & Control
Equipment Monitoring System: Features and Benefits
Key Takeaways:
The global equipment monitoring market was valued at over $3.3 billion in 2023 and is projected to reach nearly $7 billion by 2031—a clear signal that industries worldwide are recognizing its value.
Modern equipment monitoring systems can reduce unplanned equipment downtime by up to 40% and increase equipment productivity by 20–50%.
When paired with a CMMS like WorkTrek, equipment monitoring data becomes actionable—connecting real-time alerts directly to work orders, maintenance schedules, and reporting dashboards.
Equipment doesn't fail without warning. In most cases, the signs are there. It can be rising temperatures, subtle vibrations, or small dips in output. The problem is that without the right systems in place, those signals go unnoticed until it's too late.
Source: WorkTrek
That's exactly where an equipment monitoring system earns its keep.
Whether you're managing a manufacturing floor, a fleet of construction equipment, or a multi-site facility, real-time visibility into machine health transforms how your team operates.
It shifts maintenance from reactive firefighting to proactive, data-driven decision-making, which can make a strong financial case.
In this article, we'll cover what modern machine monitoring systems do, their key features, the benefits they deliver, and how pairing them with a CMMS like WorkTrek takes those benefits even further.
What Is an Equipment Monitoring System?
An equipment monitoring system is a technology solution that uses sensors, data collection tools, and software to continuously track the performance, condition, and health of machinery and equipment.
At its core, the system gathers real-time data on parameters such as:
Temperature, vibration
Pressure
Energy consumption
Operating speed
These monitoring system then analyzes it to surface insights, trigger alerts, and support informed decisions about maintenance and operations.
Modern machine monitoring systems can operate over both wired or wireless networks and integrate with existing infrastructure. This includes ERP platforms, CMMS software, and IoT frameworks.
Source: WorkTrek
The result is a connected ecosystem in which every piece of production equipment continuously reports its status.
The market for these systems is growing fast.
According to Verified Market Research, the global equipment monitoring market was valued at $4.4 billion in 2023 and is projected to reach nearly $7 billion by 2031, growing at a CAGR of 6.45%. Businesses in manufacturing, oil and gas, construction, and energy are all accelerating adoption as the cost of unexpected equipment failures continues to climb.
Key Features of a Robust Equipment Monitoring System
Not all equipment monitoring software is built the same. Here are the key features that distinguish a robust equipment monitoring system from one that merely collects data without delivering value.
Real-Time Data Collection and Monitoring
The core of any machine monitoring solution is the ability to collect data continuously and display it in real time. Sensors mounted on equipment capture readings at regular intervals and transmit that data to a central dashboard accessible from any device.
This real-time data collection allows operators and maintenance teams to see exactly what's happening with each piece of equipment at any given moment. When a parameter drifts outside its acceptable range, the system flags it immediately. This is often before any physical symptom becomes visible.
Source: WorkTrek
This is like when your car signals you, based on built-in sensors, when your engine oil or coolant is low.
Real-time monitoring is especially valuable for critical production equipment where even minutes of unplanned downtime carry significant cost.
According to a 2024 Siemens study, the annual cost of an idle production line at a large automotive plant has reached $695 million.
Predictive Maintenance Alerts
One of the most powerful features of modern equipment monitoring software is its ability to generate predictive maintenance alerts based on data trends rather than fixed schedules.
Using advanced algorithms and machine learning, the system analyzes historical data alongside current readings to identify patterns that precede equipment failure.
When those patterns appear, the system issues predictive maintenance alerts enables maintenance teams time to schedule maintenance before a breakdown occurs.
This is a meaningful upgrade from traditional time-based preventive maintenance schedules. Those schedules alone can lead to both over-maintaining equipment that's still running well and under-maintaining assets approaching failure. Predictive analytics closes that gap.
Source: WorkTrek
Research by Deloitte found that predictive maintenance can increase equipment uptime by 10–20% and reduce overall maintenance costs by 5–10%. For companies with large equipment portfolios, those percentages represent enormous savings.
Remote Monitoring and Data Access
Modern machine monitoring systems are no longer limited to on-site terminals.
Remote monitoring solutions allow technicians, supervisors, and facility managers to access live equipment data from anywhere.
This capability is particularly valuable for organizations managing construction equipment spread across job sites, fleets operating across regions, or manufacturing operations with multiple production lines.
Instead of relying on manual rounds or delayed reports, stakeholders get direct data access to machine performance at all times.
Remote monitoring also reduces the time maintenance teams spend on manual inspection—ScienceSoft estimates up to 90% of inspection time can be eliminated through automated remote data collection, freeing technicians for higher-value work.
Advanced Analytics and Historical Data
Raw sensor readings only tell part of the story.
What turns data into insight is advanced analytics is the ability to process, visualize, and interpret equipment data over time.
A well-designed equipment monitoring system stores historical data on machine performance, maintenance events, and failure incidents, then surfaces trends through dashboards and reporting tools. Teams can use this information to identify bottlenecks in production lines, understand the root causes of failures, benchmark machine efficiency across assets, and refine their maintenance strategies.
Source: WorkTrek
Data analytics also supports more accurate maintenance budgeting. Rather than relying on estimates or industry averages, managers can build forecasts grounded in their equipment's actual operating history. This is what data-driven decision making looks like in practice.
Equipment Health and KPI Tracking
A robust equipment monitoring system tracks specific key performance indicators for each asset such as utilization rates, cycle times, uptime/downtime ratios, energy consumption, and more. These KPIs give teams an objective measure of machine health and efficiency over time.
By consistently tracking and reviewing these metrics, operations managers can spot declining machine performance before it becomes a crisis. If a piece of equipment that typically runs at 95% efficiency starts dropping to 85%, that's a signal worth investigating—not ignoring until the machine stops working.
KPI tracking also supports quality control objectives. In manufacturing processes where machine performance directly impacts product quality, early detection of performance degradation can prevent defective output from reaching customers.
Seamless Integration with Existing Systems
Equipment monitoring software should not operate in isolation.
The best solutions are designed to integrate with a facility's existing infrastructure by connecting data from sensors and control systems to ERP platforms, asset management tools, and CMMS software.
Data can be transmitted via both wired or wireless networks, and many modern systems support radio frequency identification (RFID) tagging for tracking equipment location and availability.
Open APIs allow organizations to connect monitoring data with billing, procurement, and compliance systems.
Source: WorkTrek
This integration can elminate data silos and gives every stakeholder, from technicians on the floor to executives in the boardroom, a unified view of equipment operation across the organization.
Benefits of Implementing an Equipment Monitoring System
Understanding the features is useful. Understanding what those features actually deliver for your business is what drives adoption. Here's how equipment monitoring translates into tangible operational and financial outcomes.
Reduce Downtime Significantly
The most direct benefit of equipment monitoring is the ability to reduce downtime. By detecting potential equipment failures early, teams can address issues before they escalate into full breakdowns—keeping production lines running and avoiding the catastrophic cost of unplanned stoppages.
ScienceSoft's implementation data shows that equipment monitoring solutions can reduce downtime by up to 40% through predictive maintenance. That's not a marginal improvement—for facilities where every hour of downtime carries five- or six-figure costs, it's a fundamental shift in operational risk.
Source: WorkTrek
Reduce Maintenance Costs
Minimizing downtime and reducing maintenance costs go hand in hand. When equipment monitoring enables proactive maintenance, teams spend less on emergency repairs, expedited parts orders, and overtime labor.
But the savings go further. Because monitoring systems track energy consumption in real time, they also help identify equipment operating inefficiently. This is equipment that might be consuming more power than normal, often due to mechanical issues that haven't yet caused a failure.
Addressing those inefficiencies reduces operating costs even before a breakdown occurs.
Improve Operational Efficiency and Productivity
Equipment monitoring systems provide the data operations teams need to optimize machine performance across every production shift. When you can see machine availability, cycle times, and throughput metrics in real time, you can make adjustments quickly—redistributing loads, scheduling maintenance during low-demand periods, and ensuring production equipment stays at peak efficiency.
Illustration: WorkTrek
This kind of data-driven operational management consistently improves overall operational efficiency. ScienceSoft reports equipment productivity increases of 20–50% after deploying a comprehensive monitoring solution. This is a range that reflects the significant untapped efficiency that exists in most facilities before visibility is introduced.
Support Regulatory Compliance
Many industries, such as healthcare, food processing, pharmaceuticals, and oil and gas, operate under strict regulatory requirements.
An equipment monitoring system provides an auditable record of machine health, inspection history, and maintenance activities that simplifies regulatory compliance.
Automated reports and digital logs replace manual paperwork, reducing the risk of documentation errors that can create compliance exposure.
During an audit, teams have a complete, timestamped record of every maintenance action and equipment parameter reading.
Enable Data-Driven Decision Making
Perhaps the most strategic benefit of equipment monitoring is what it does for how organizations make decisions. When machine performance data is consistently captured, analyzed, and reported, every decision—from capital expenditure planning to staffing to maintenance strategy—can be grounded in evidence rather than intuition.
Should you repair or replace an aging piece of machinery?
Equipment monitoring data gives you the answer. Are your production lines running at capacity, or is there a bottleneck limiting throughput? The data tells you. Are your maintenance costs trending in the right direction? The KPIs show you.
Source: WorkTrek
How a CMMS Amplifies the Value of Equipment Monitoring
An equipment monitoring system tells you what's happening with your machines. A CMMS tells you what to do about it, and ensures those actions are tracked, completed, and documented.
Used together, they form a closed-loop maintenance system that is dramatically more effective than either tool alone.
From Alert to Action: Closing the Loop
When an equipment monitoring system generates a predictive maintenance alert, that alert is only as valuable as the response it triggers.
Without a connected workflow, that alert might appear on a dashboard and get missed. With a CMMS, it can automatically trigger a work order, assign it to the right technician, attach relevant equipment history, and track the resolution from start to finish.
This is how you move from monitoring to action at scale—without relying on manual handoffs, phone calls, or spreadsheet updates to bridge the gap.
Source: WorkTrek
Where Equipment Monitoring Makes the Biggest Impact
Equipment monitoring systems deliver value across a wide range of industries and asset types. Some of the highest-impact applications include:
Manufacturing Operations
Production lines depend on consistent machine performance. Monitoring systems track cycle times, throughput, and machine health across every station, enabling teams to identify bottlenecks and catch issues before they halt production.
Construction Equipment
Heavy construction equipment operating across job sites is difficult to monitor manually. Remote monitoring solutions allow equipment managers to track machine performance, fuel consumption, and utilization in real time. This can reduce costly breakdowns on-site and optimize equipment deployment.
Facility Management
HVAC systems, electrical equipment, elevators, and other building systems benefit from continuous monitoring. Automated alerts help facility teams address issues before they affect occupants or create safety concerns.
Source: WorkTrek
Energy and Utilities
Power generation equipment operates in demanding environments where failures carry enormous consequences. Monitoring systems track vibration, temperature, and output in real time, enabling operators to schedule maintenance during planned outages rather than responding to unplanned ones.
Conclusion
Equipment monitoring systems have moved from a competitive differentiator to a baseline expectation for organizations that take maintenance seriously.
The combination of real-time data collection, predictive analytics, remote monitoring, and advanced reporting gives maintenance and operations teams a level of visibility that simply wasn't possible a decade ago.
The result is fewer unexpected equipment failures, lower maintenance costs, better regulatory compliance, and smarter business operations overall.
Source: WorkTrek
But the technology is only part of the equation. The teams that get the most from equipment monitoring are those who pair it with the right workflows. That's where a CMMS like WorkTrek becomes indispensable.
If you're looking to build a more proactive, data-driven maintenance program, start by understanding what your equipment is telling you. Then make sure you have the tools to act on it.
Make your work easier.
Try for free.
Book a demo